Tachyus
Optimizing oil and gas production
The oil and gas industry is one of the most critical industries on the planet. It’s the reason most of us can go places, it’s the reason most of us can get our food. Tachyus creates technology to optimize oil and gas production with machine learning and physics.
During the years as a founding and solo designer, I collaborated with a team of software developers and petroleum engineers to revolutionize the oil and gas industry by leveraging data to make profitable decisions.
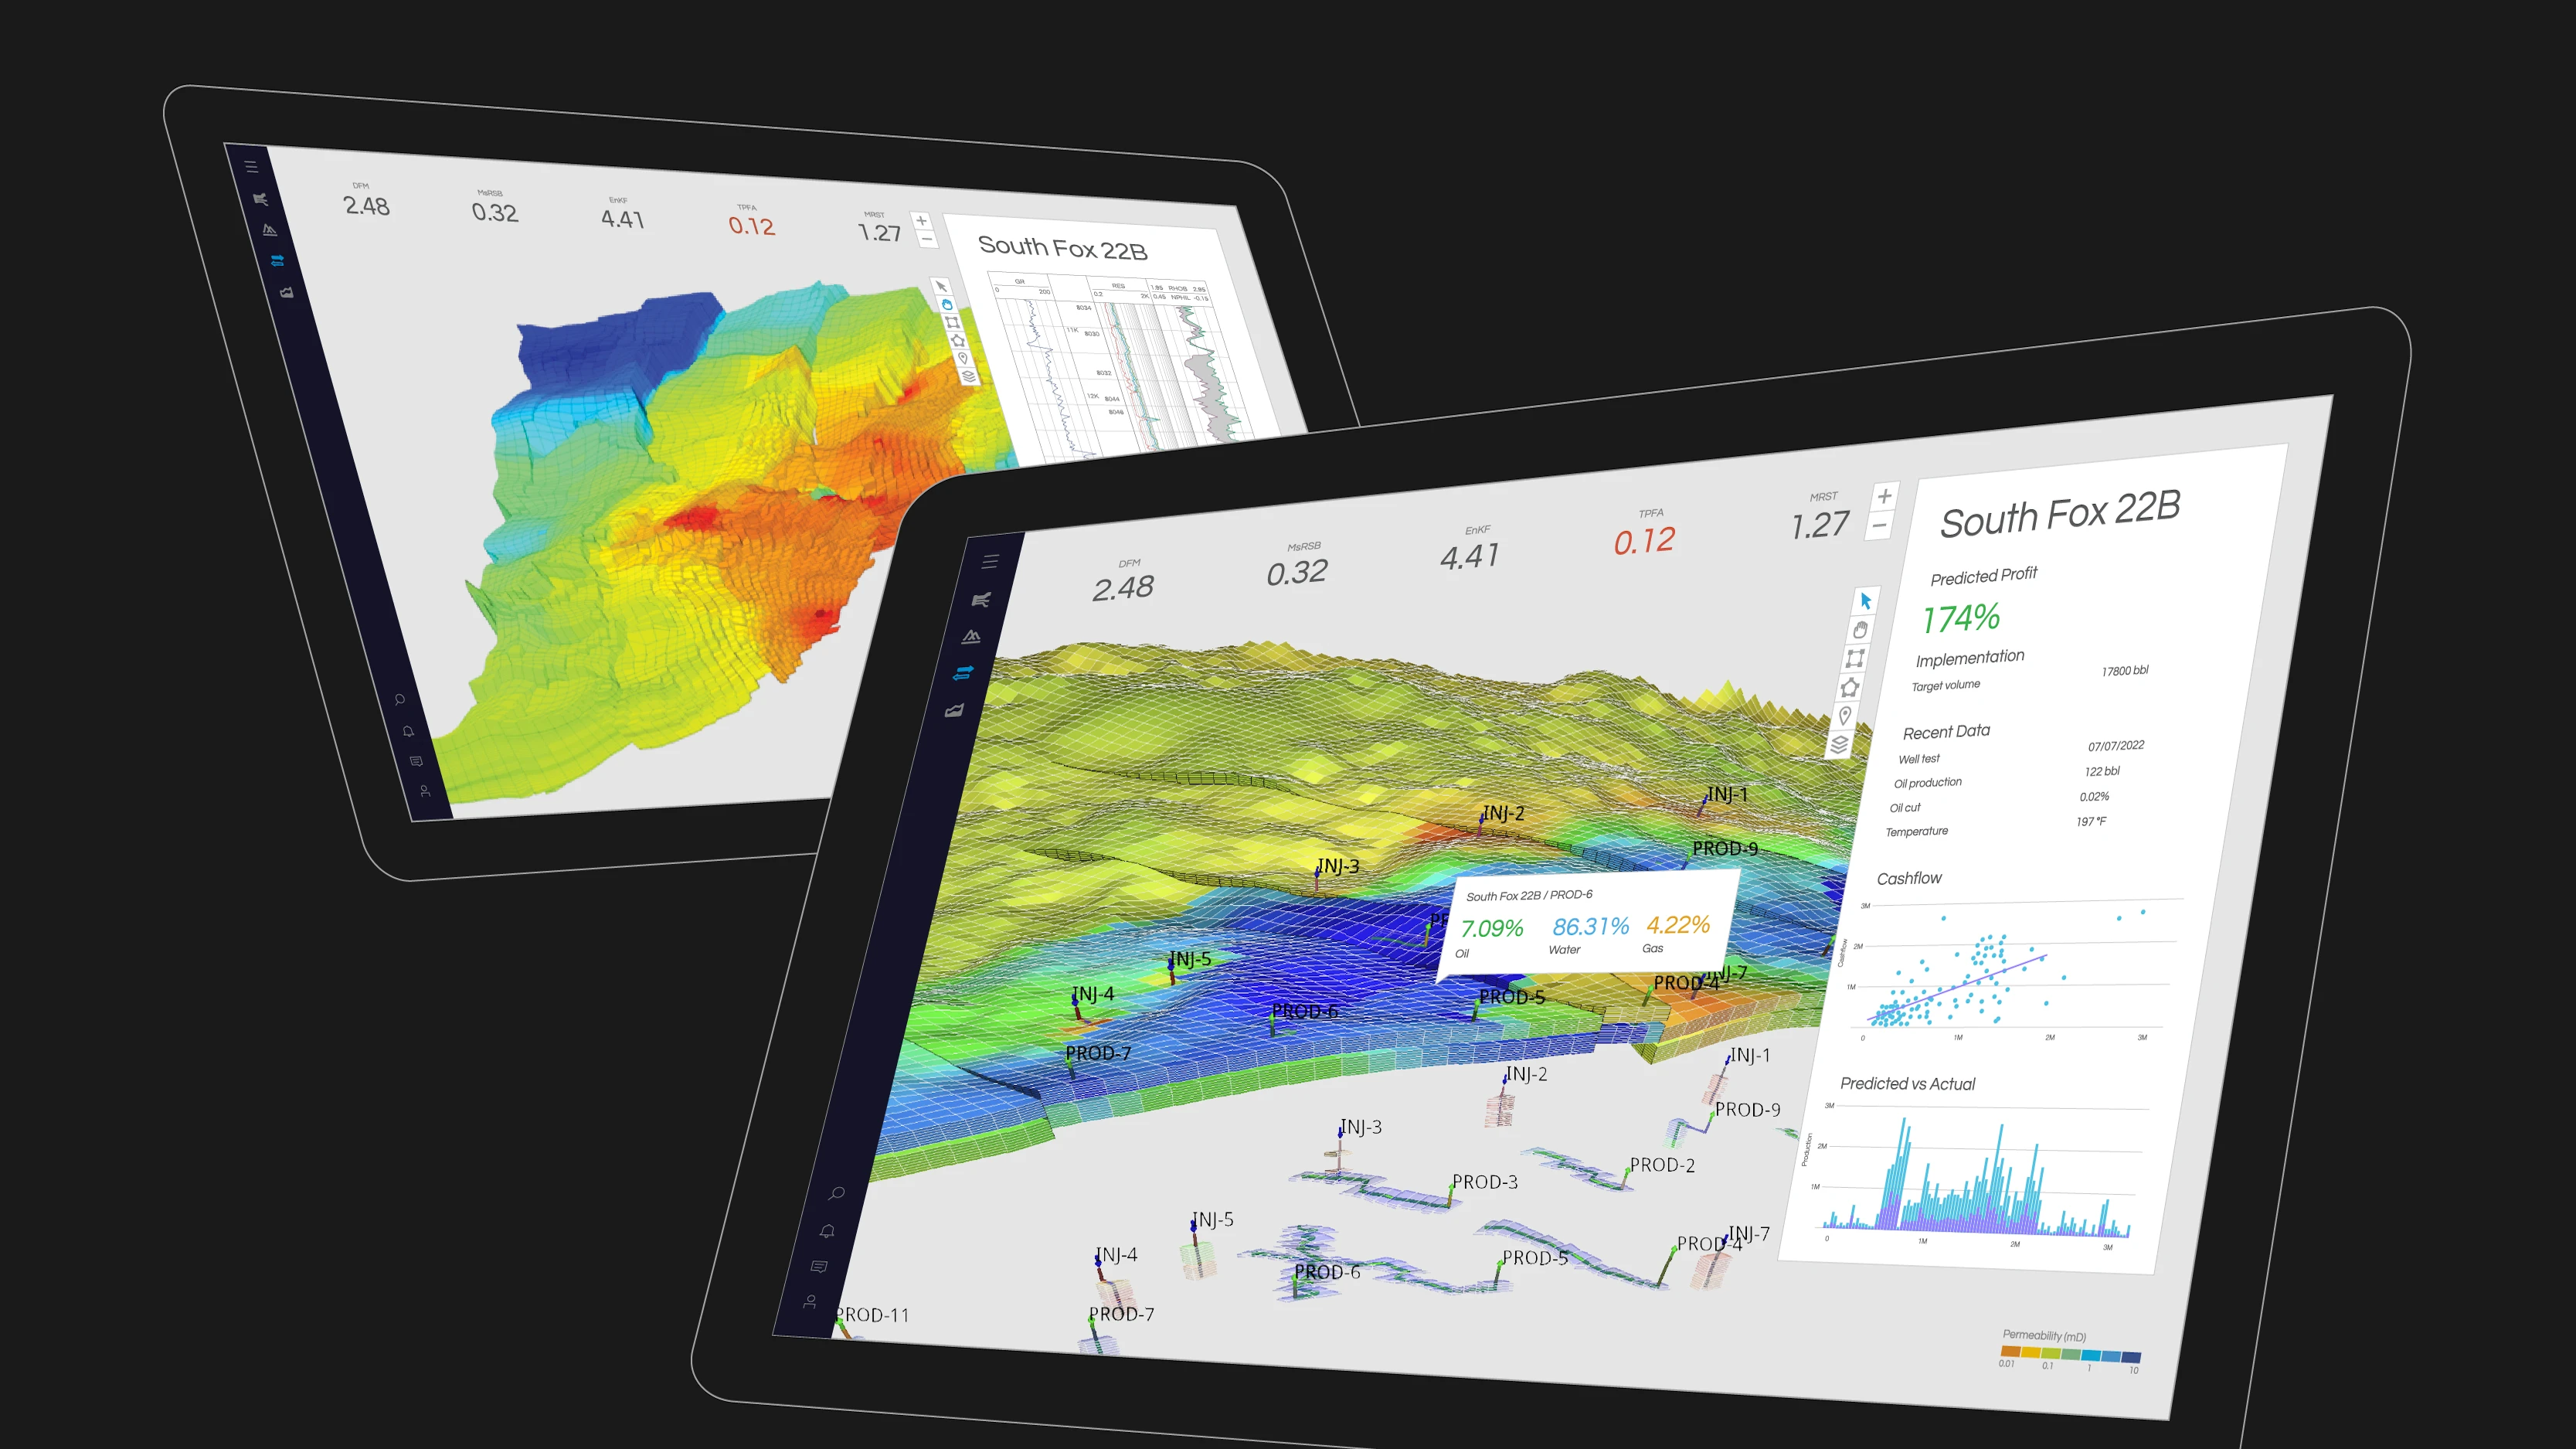
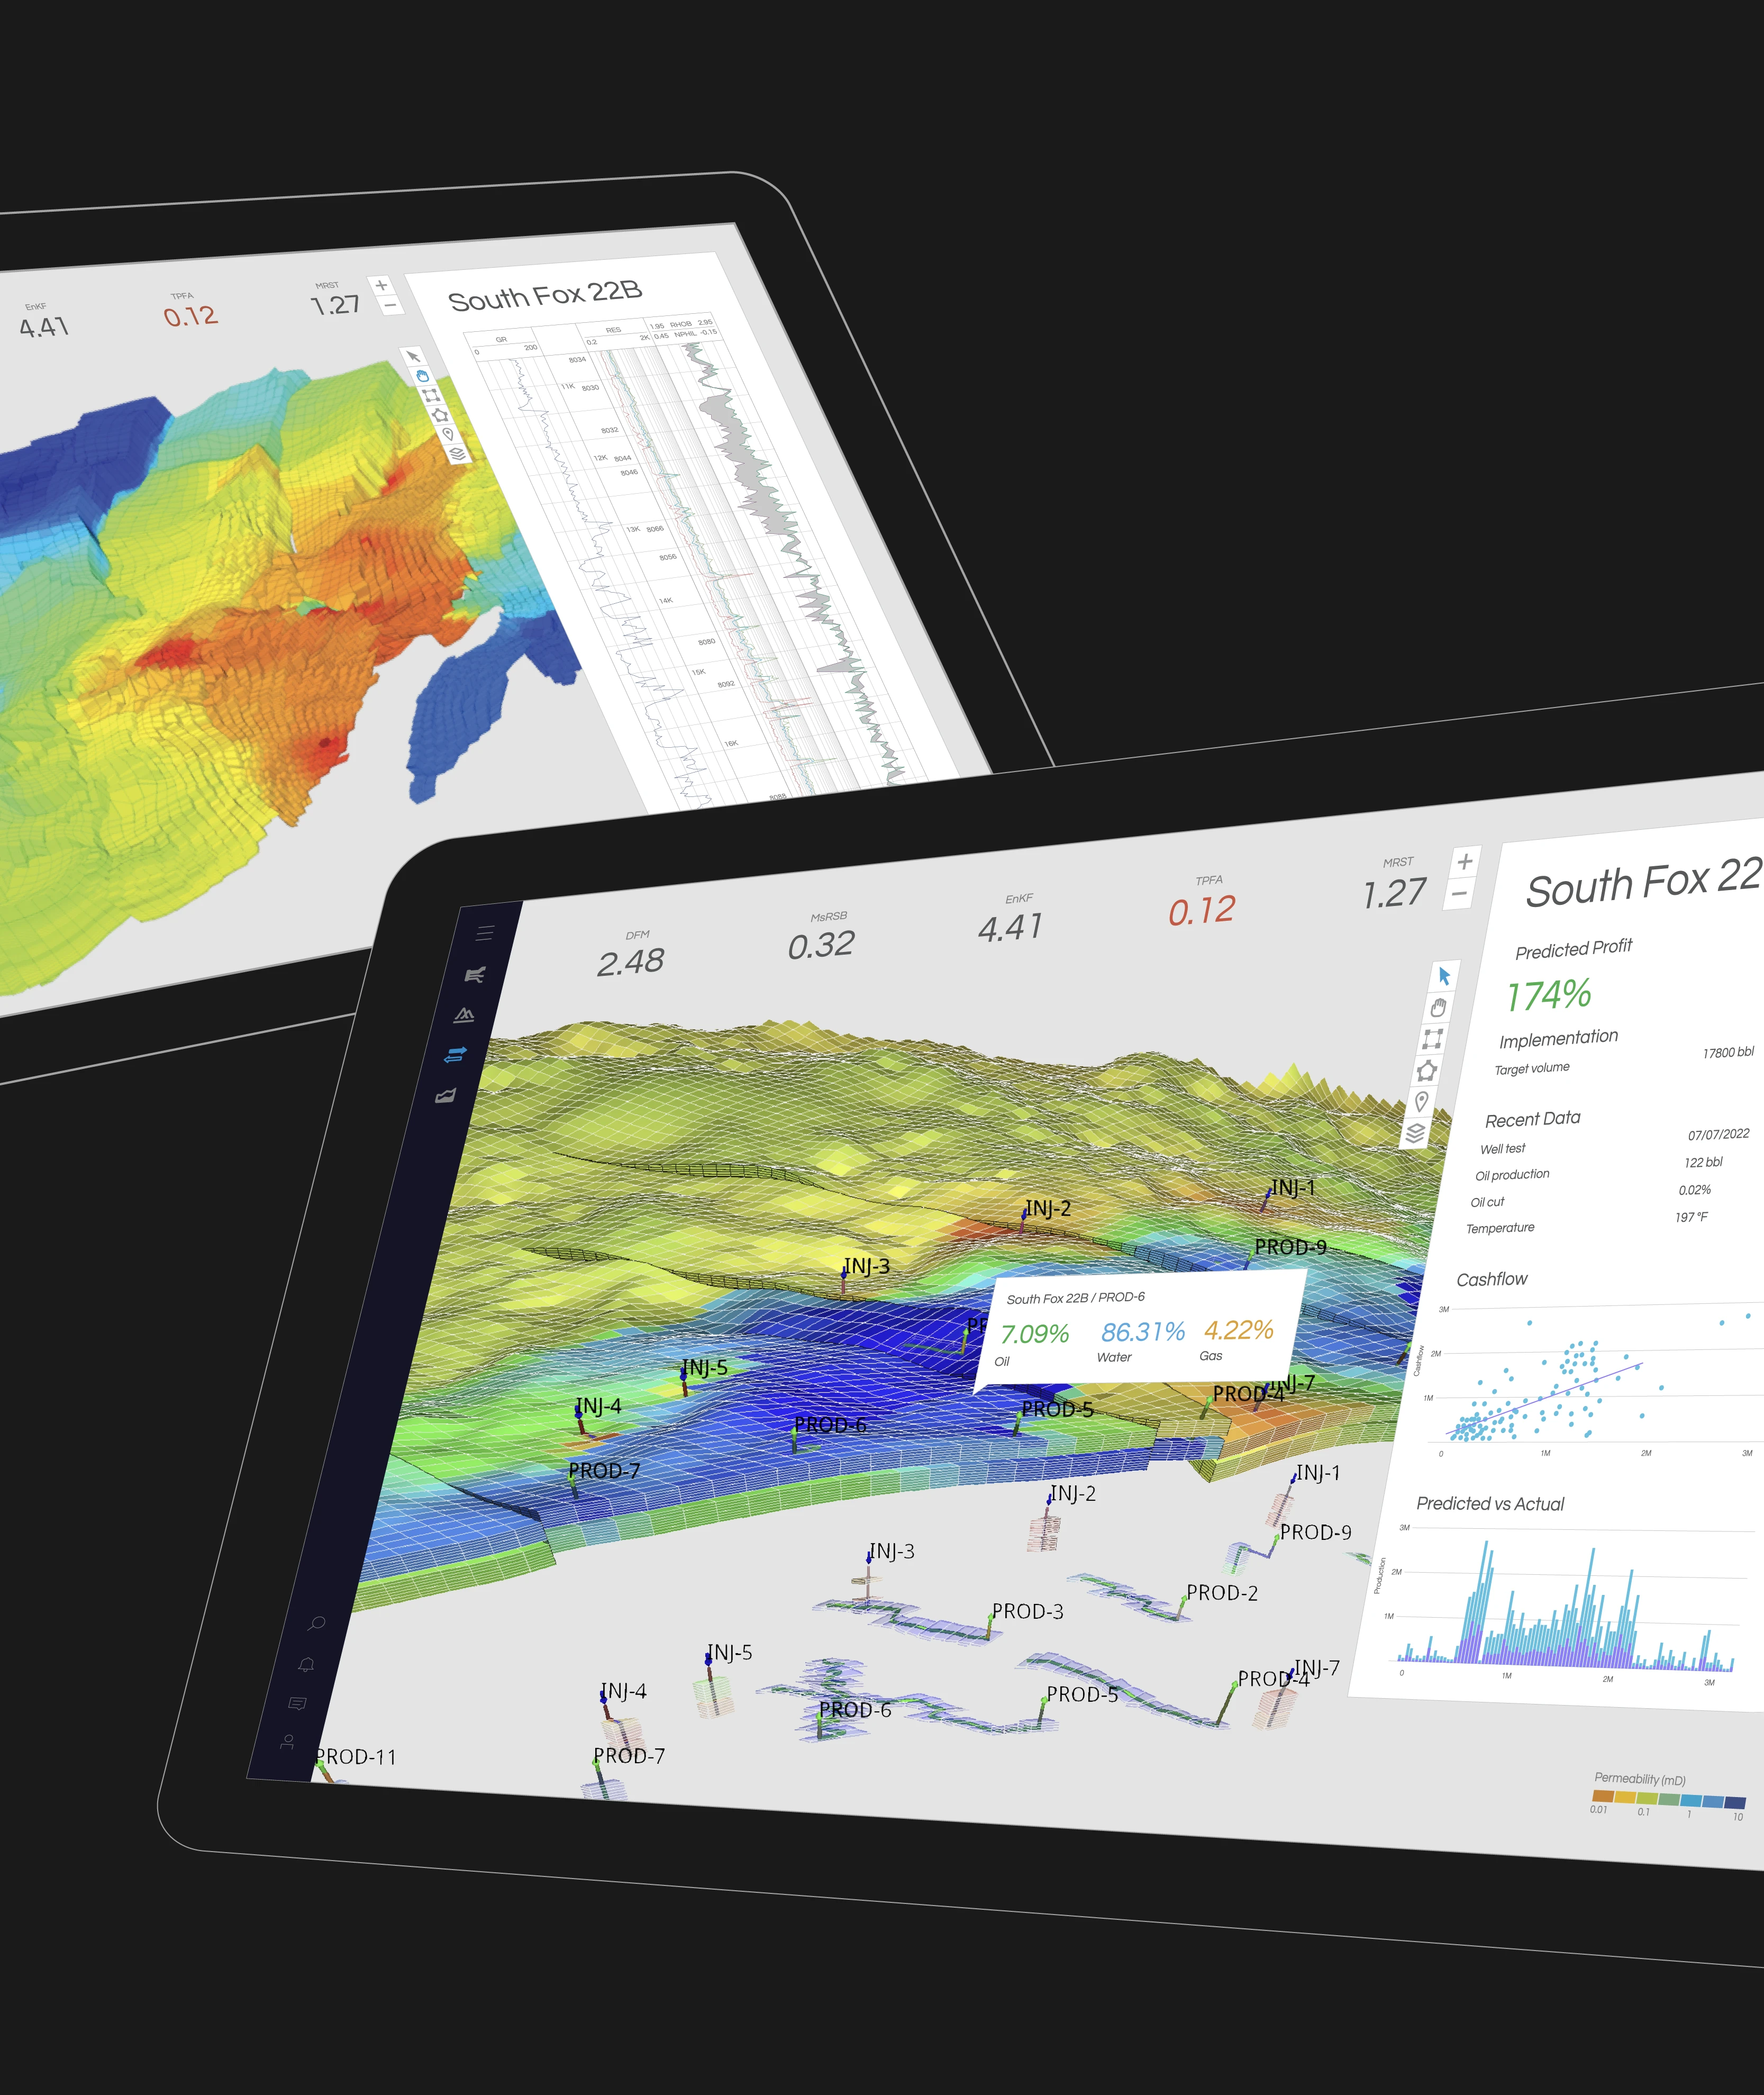
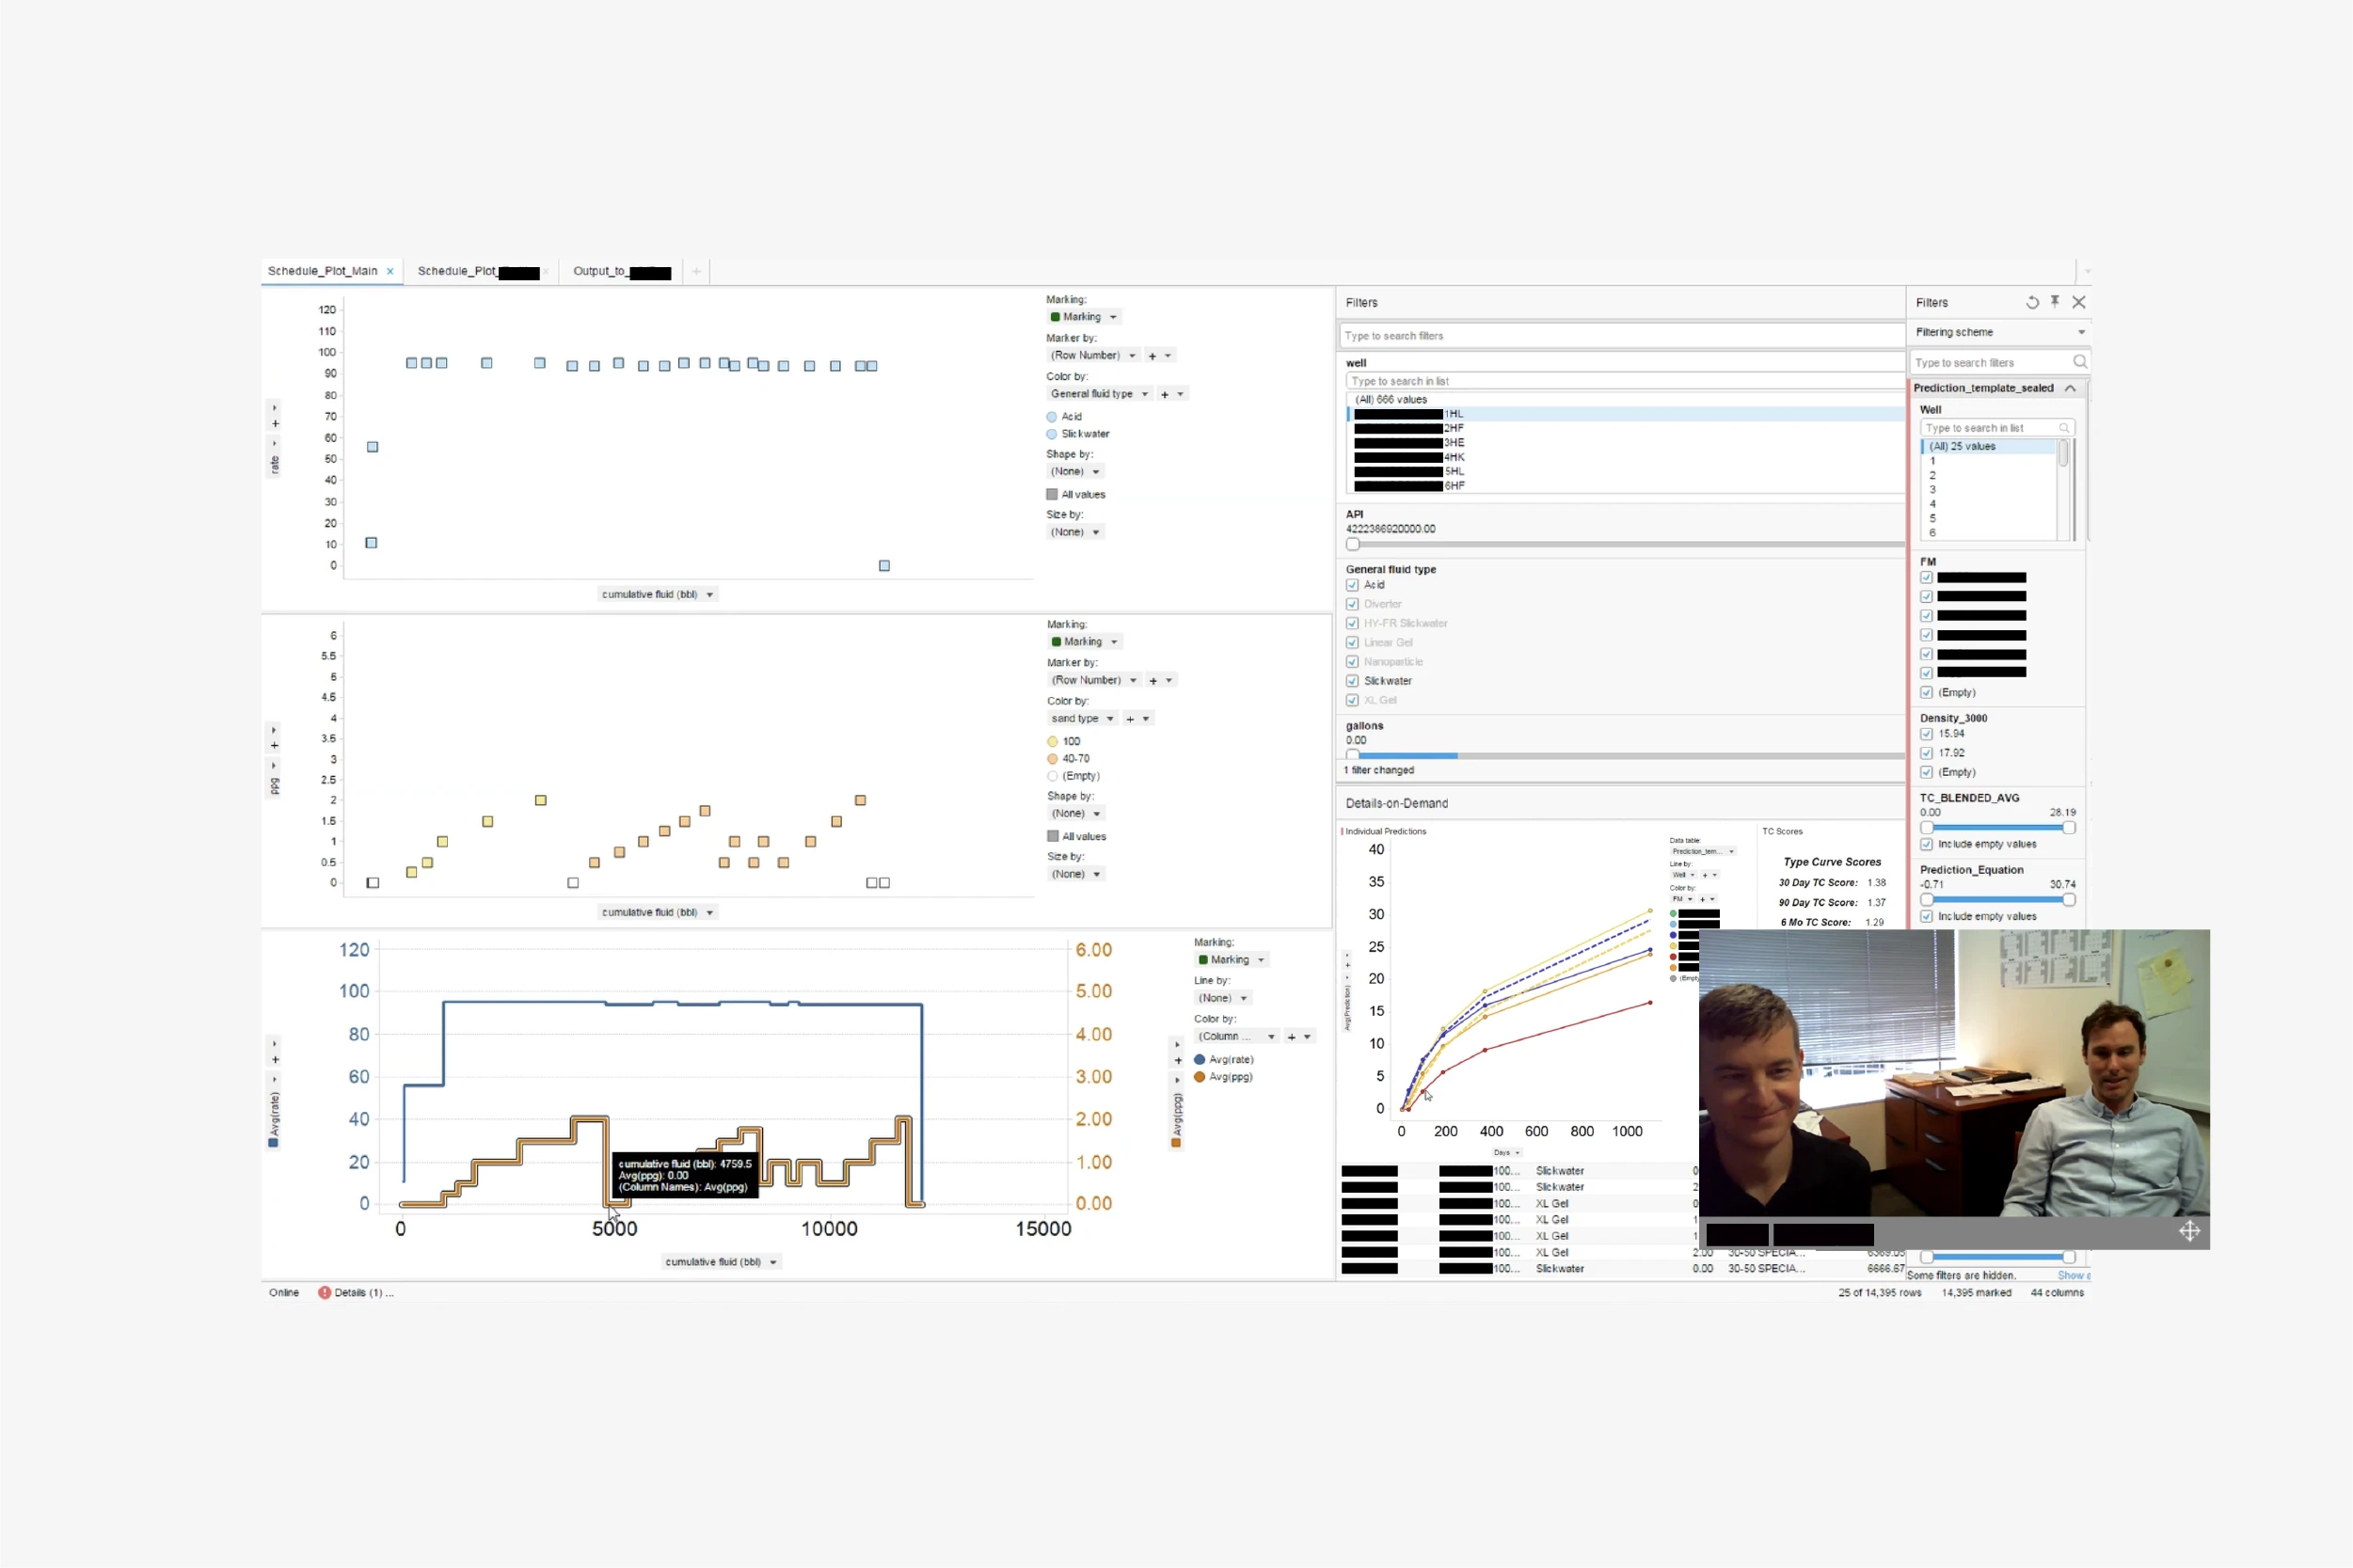
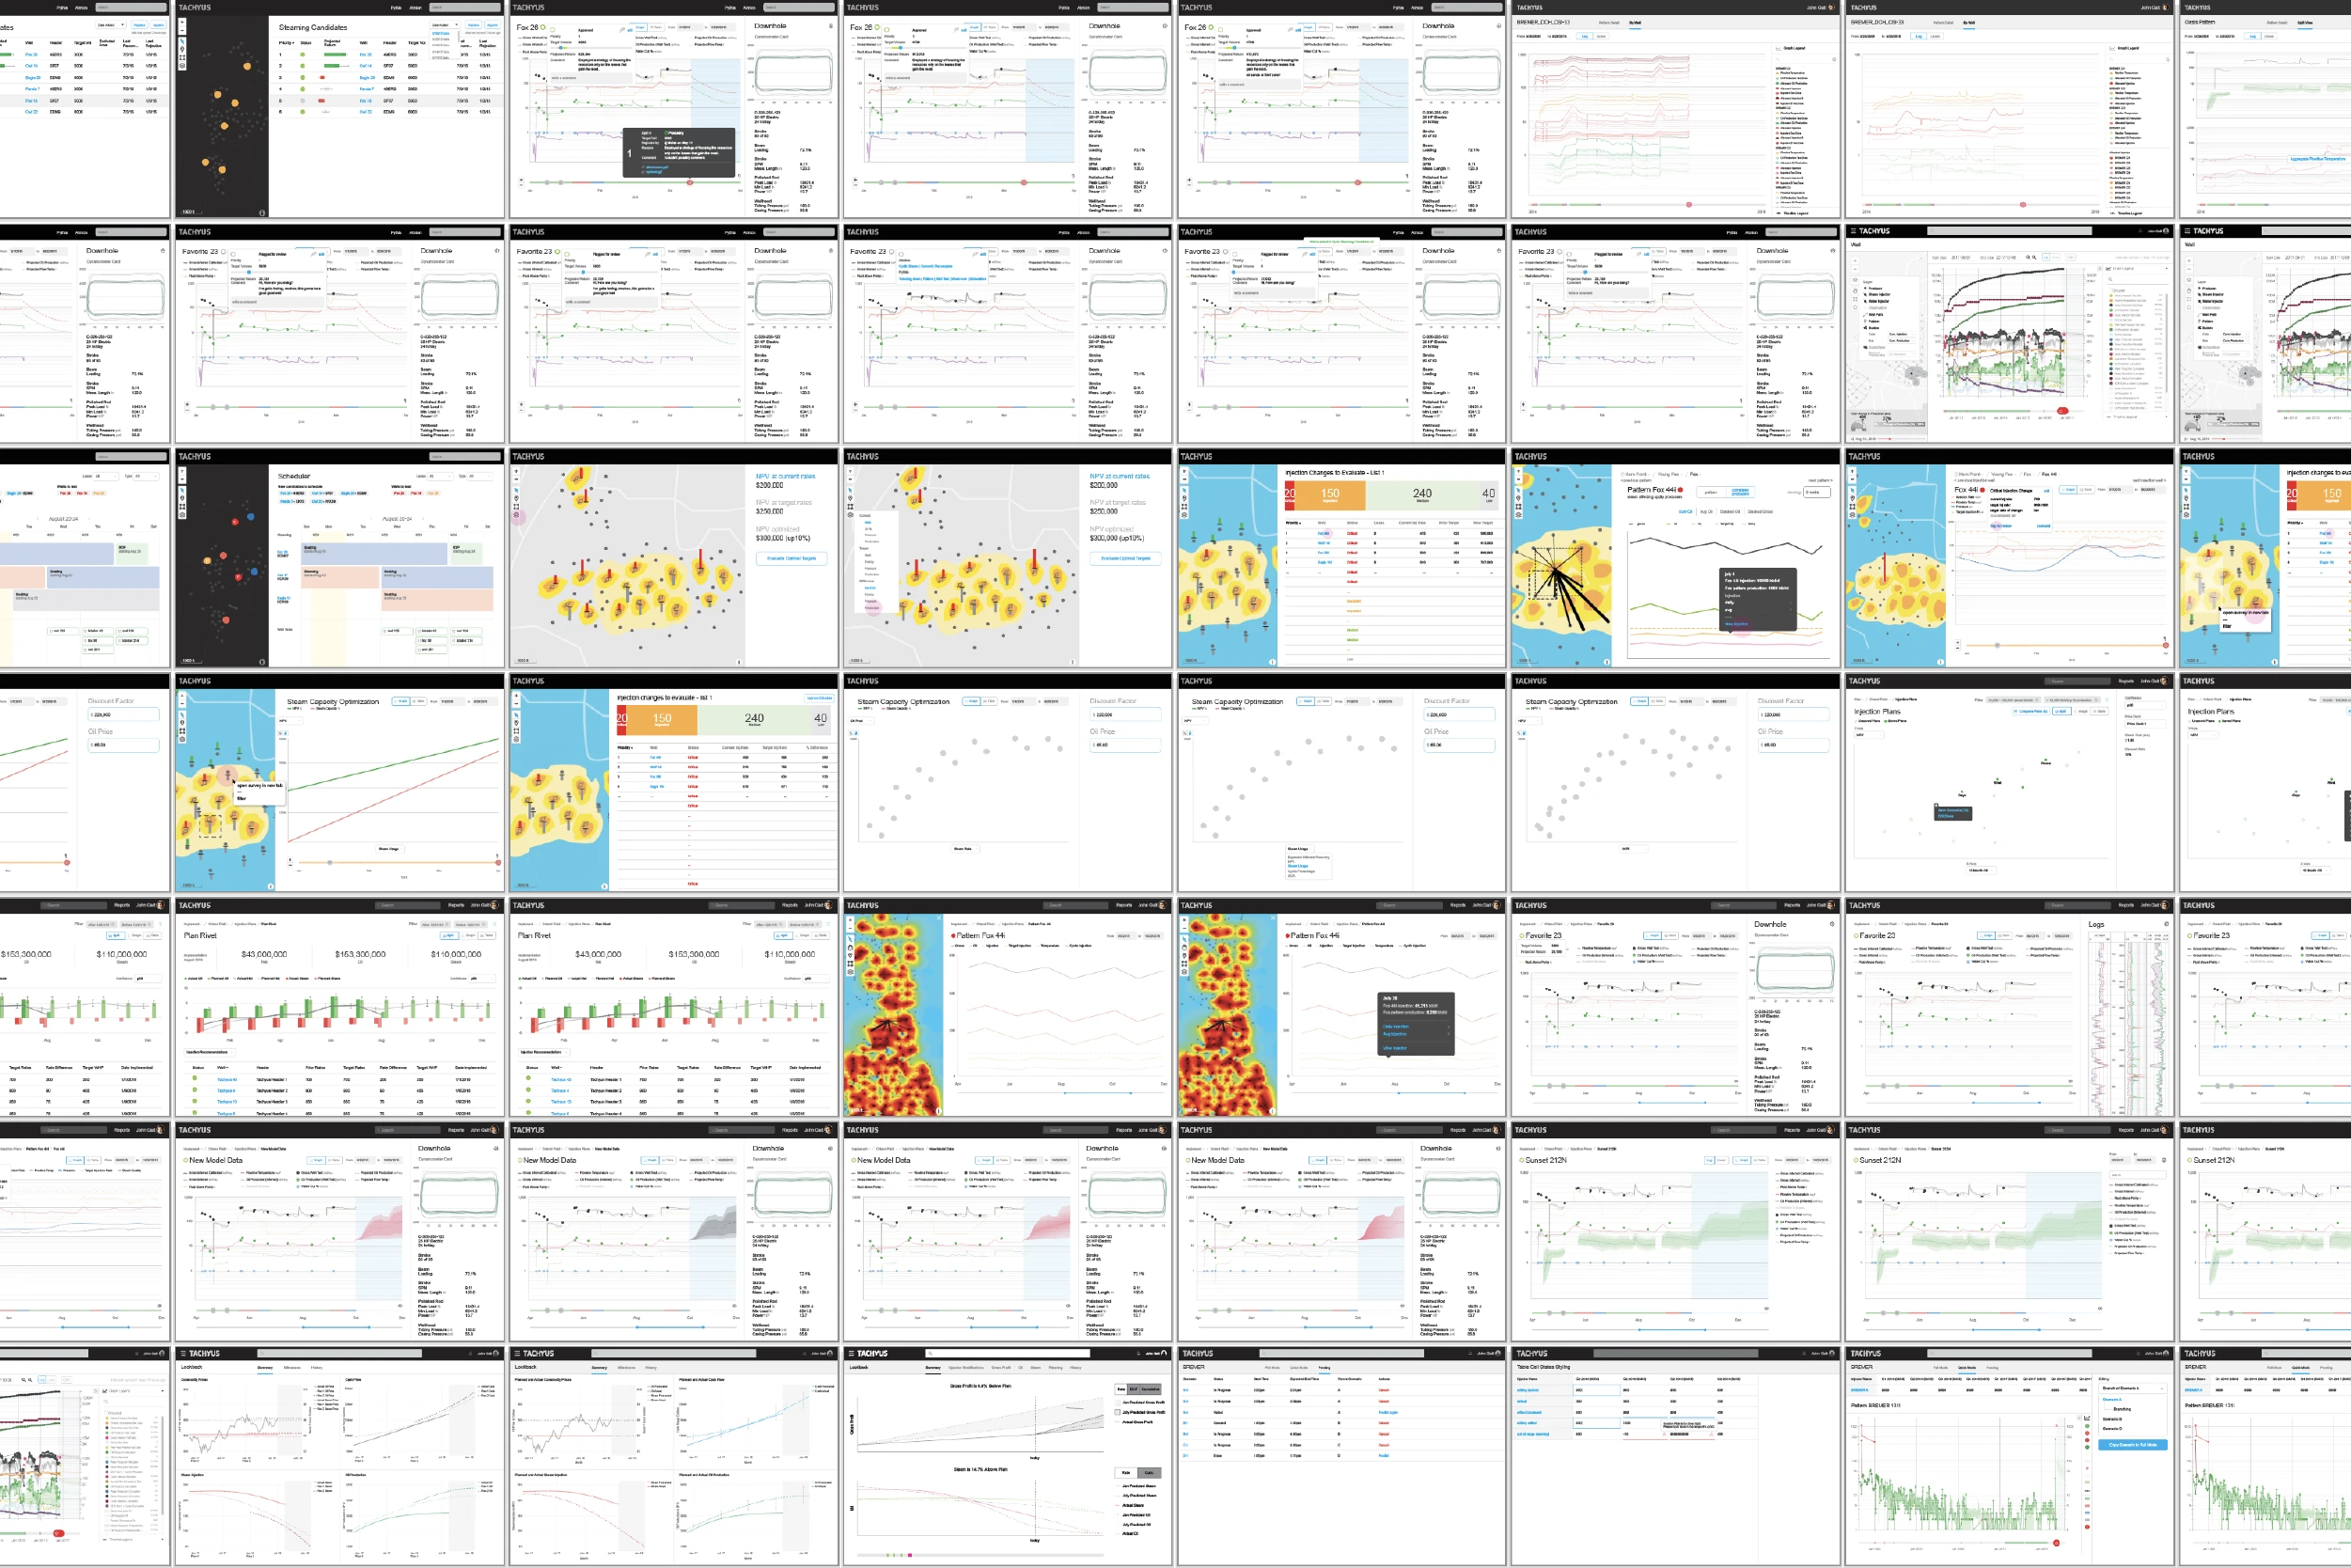
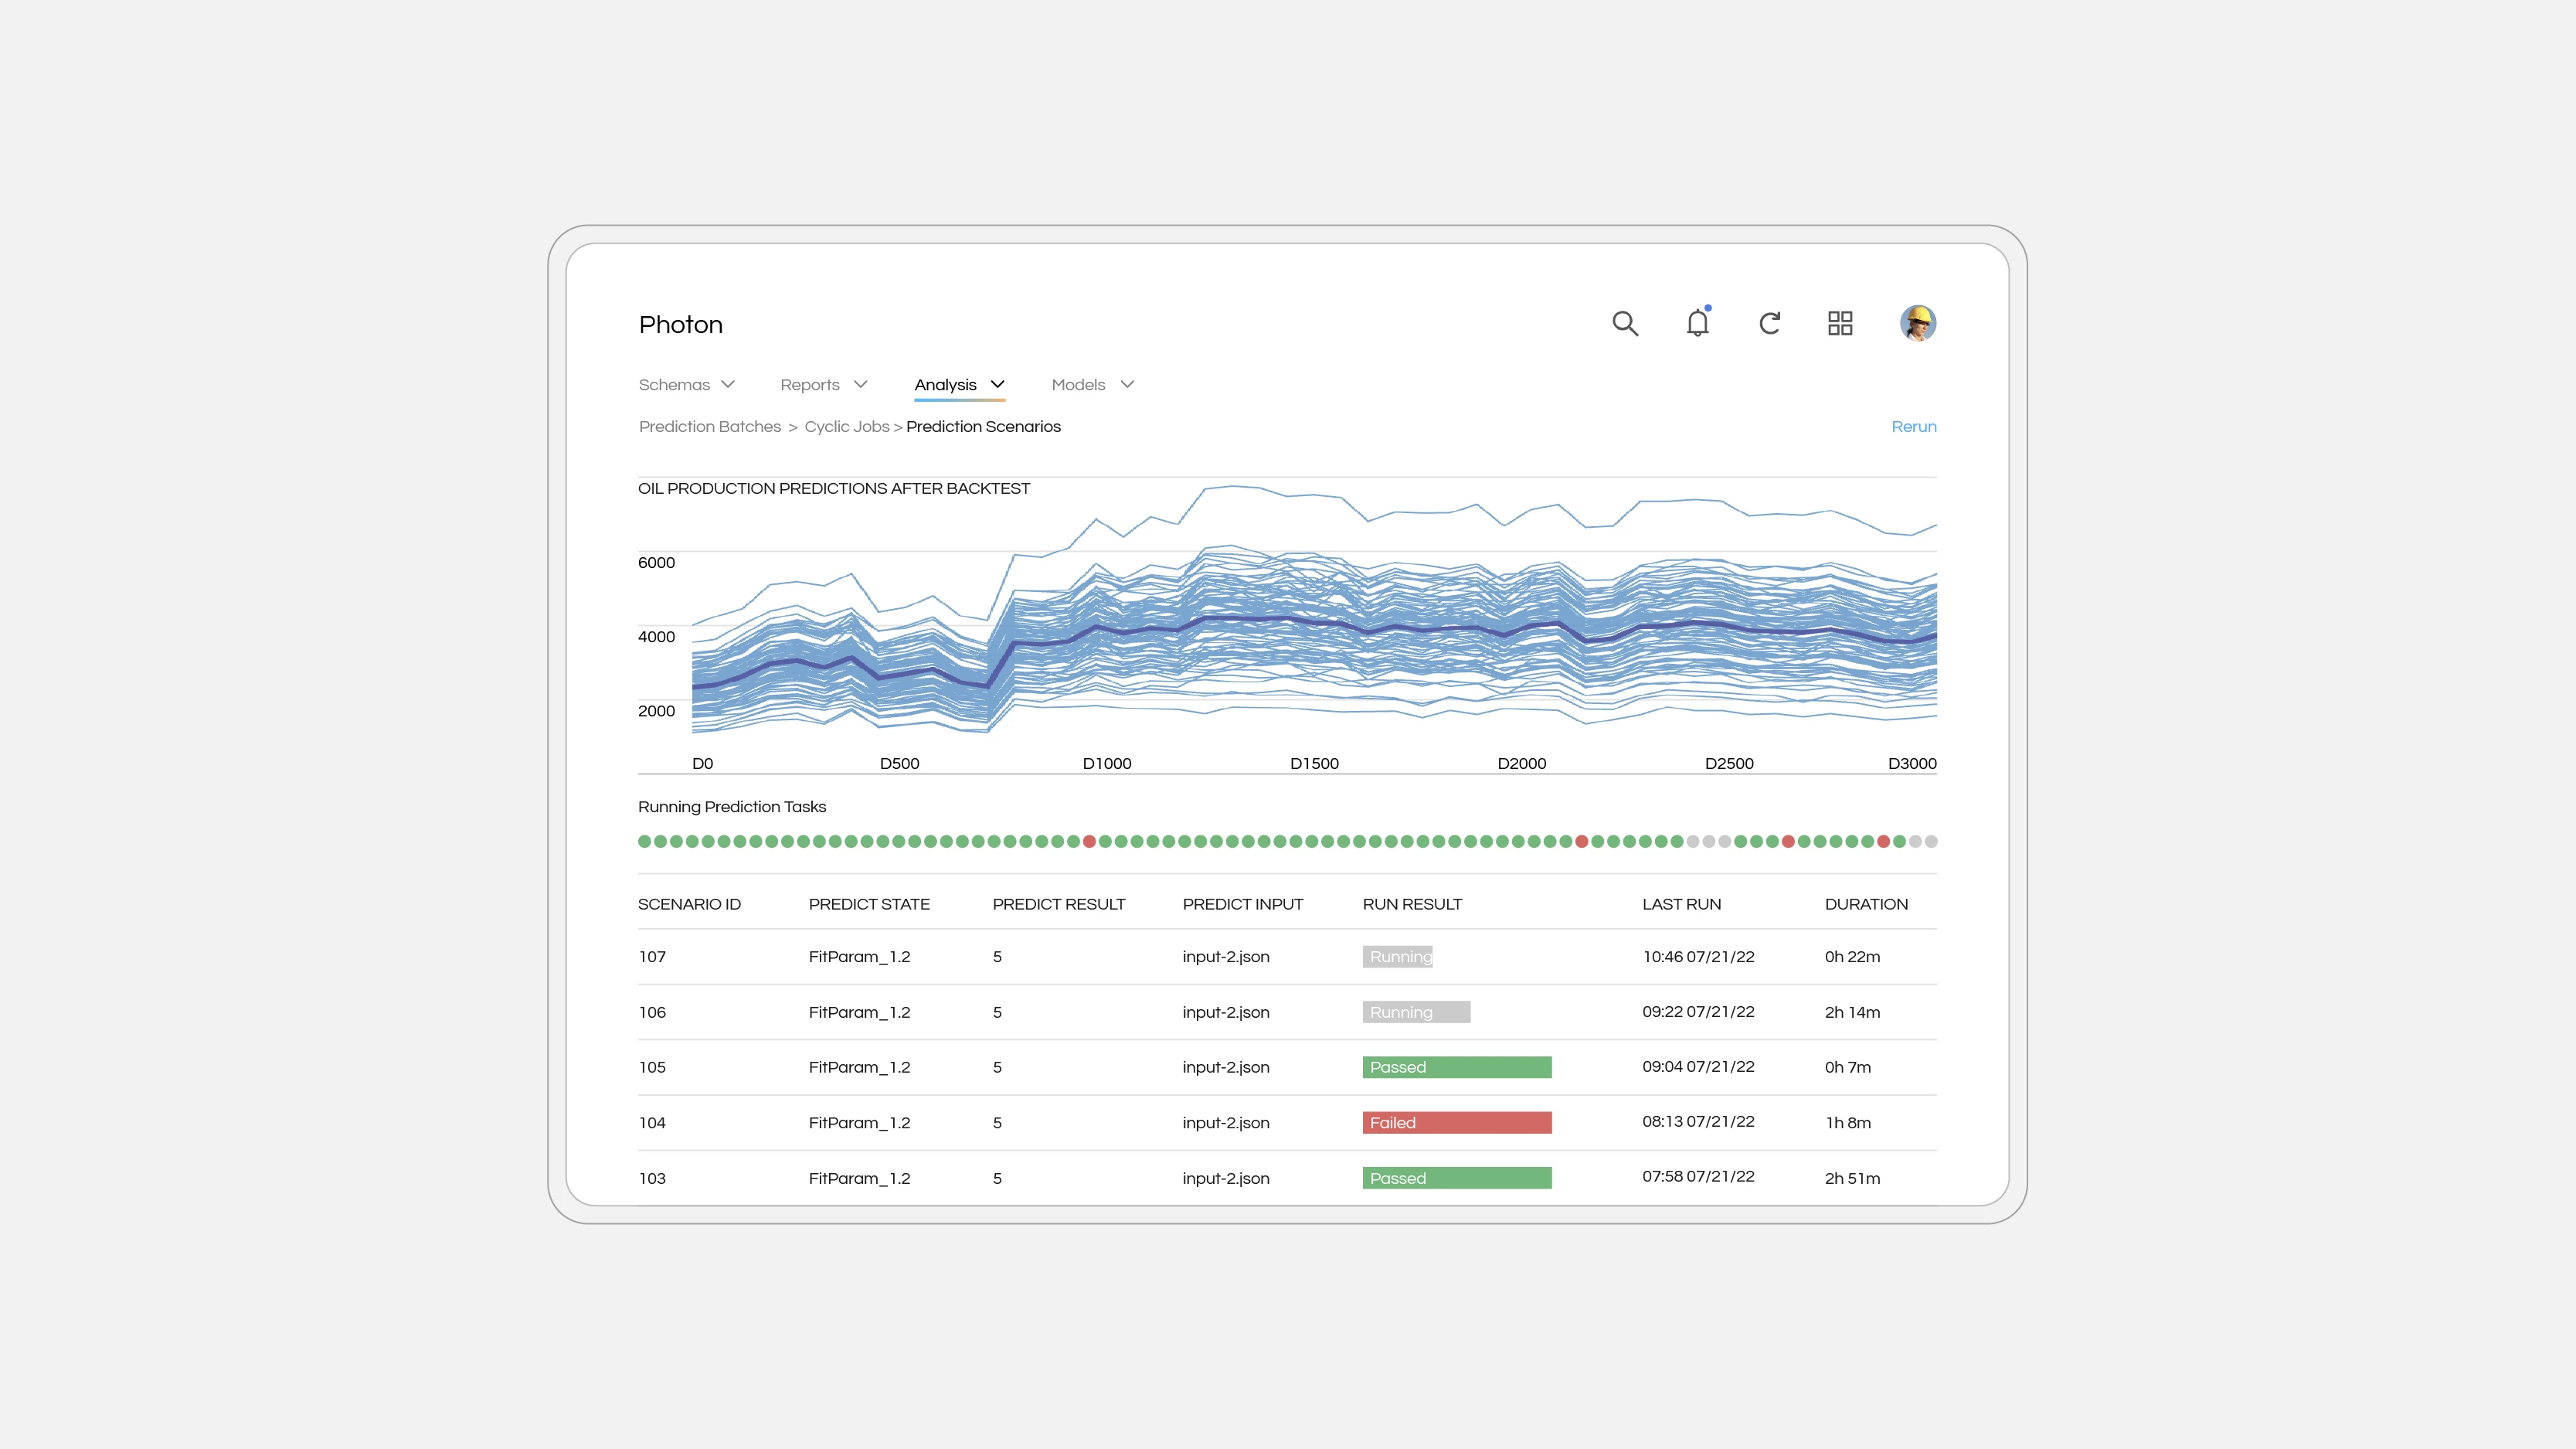
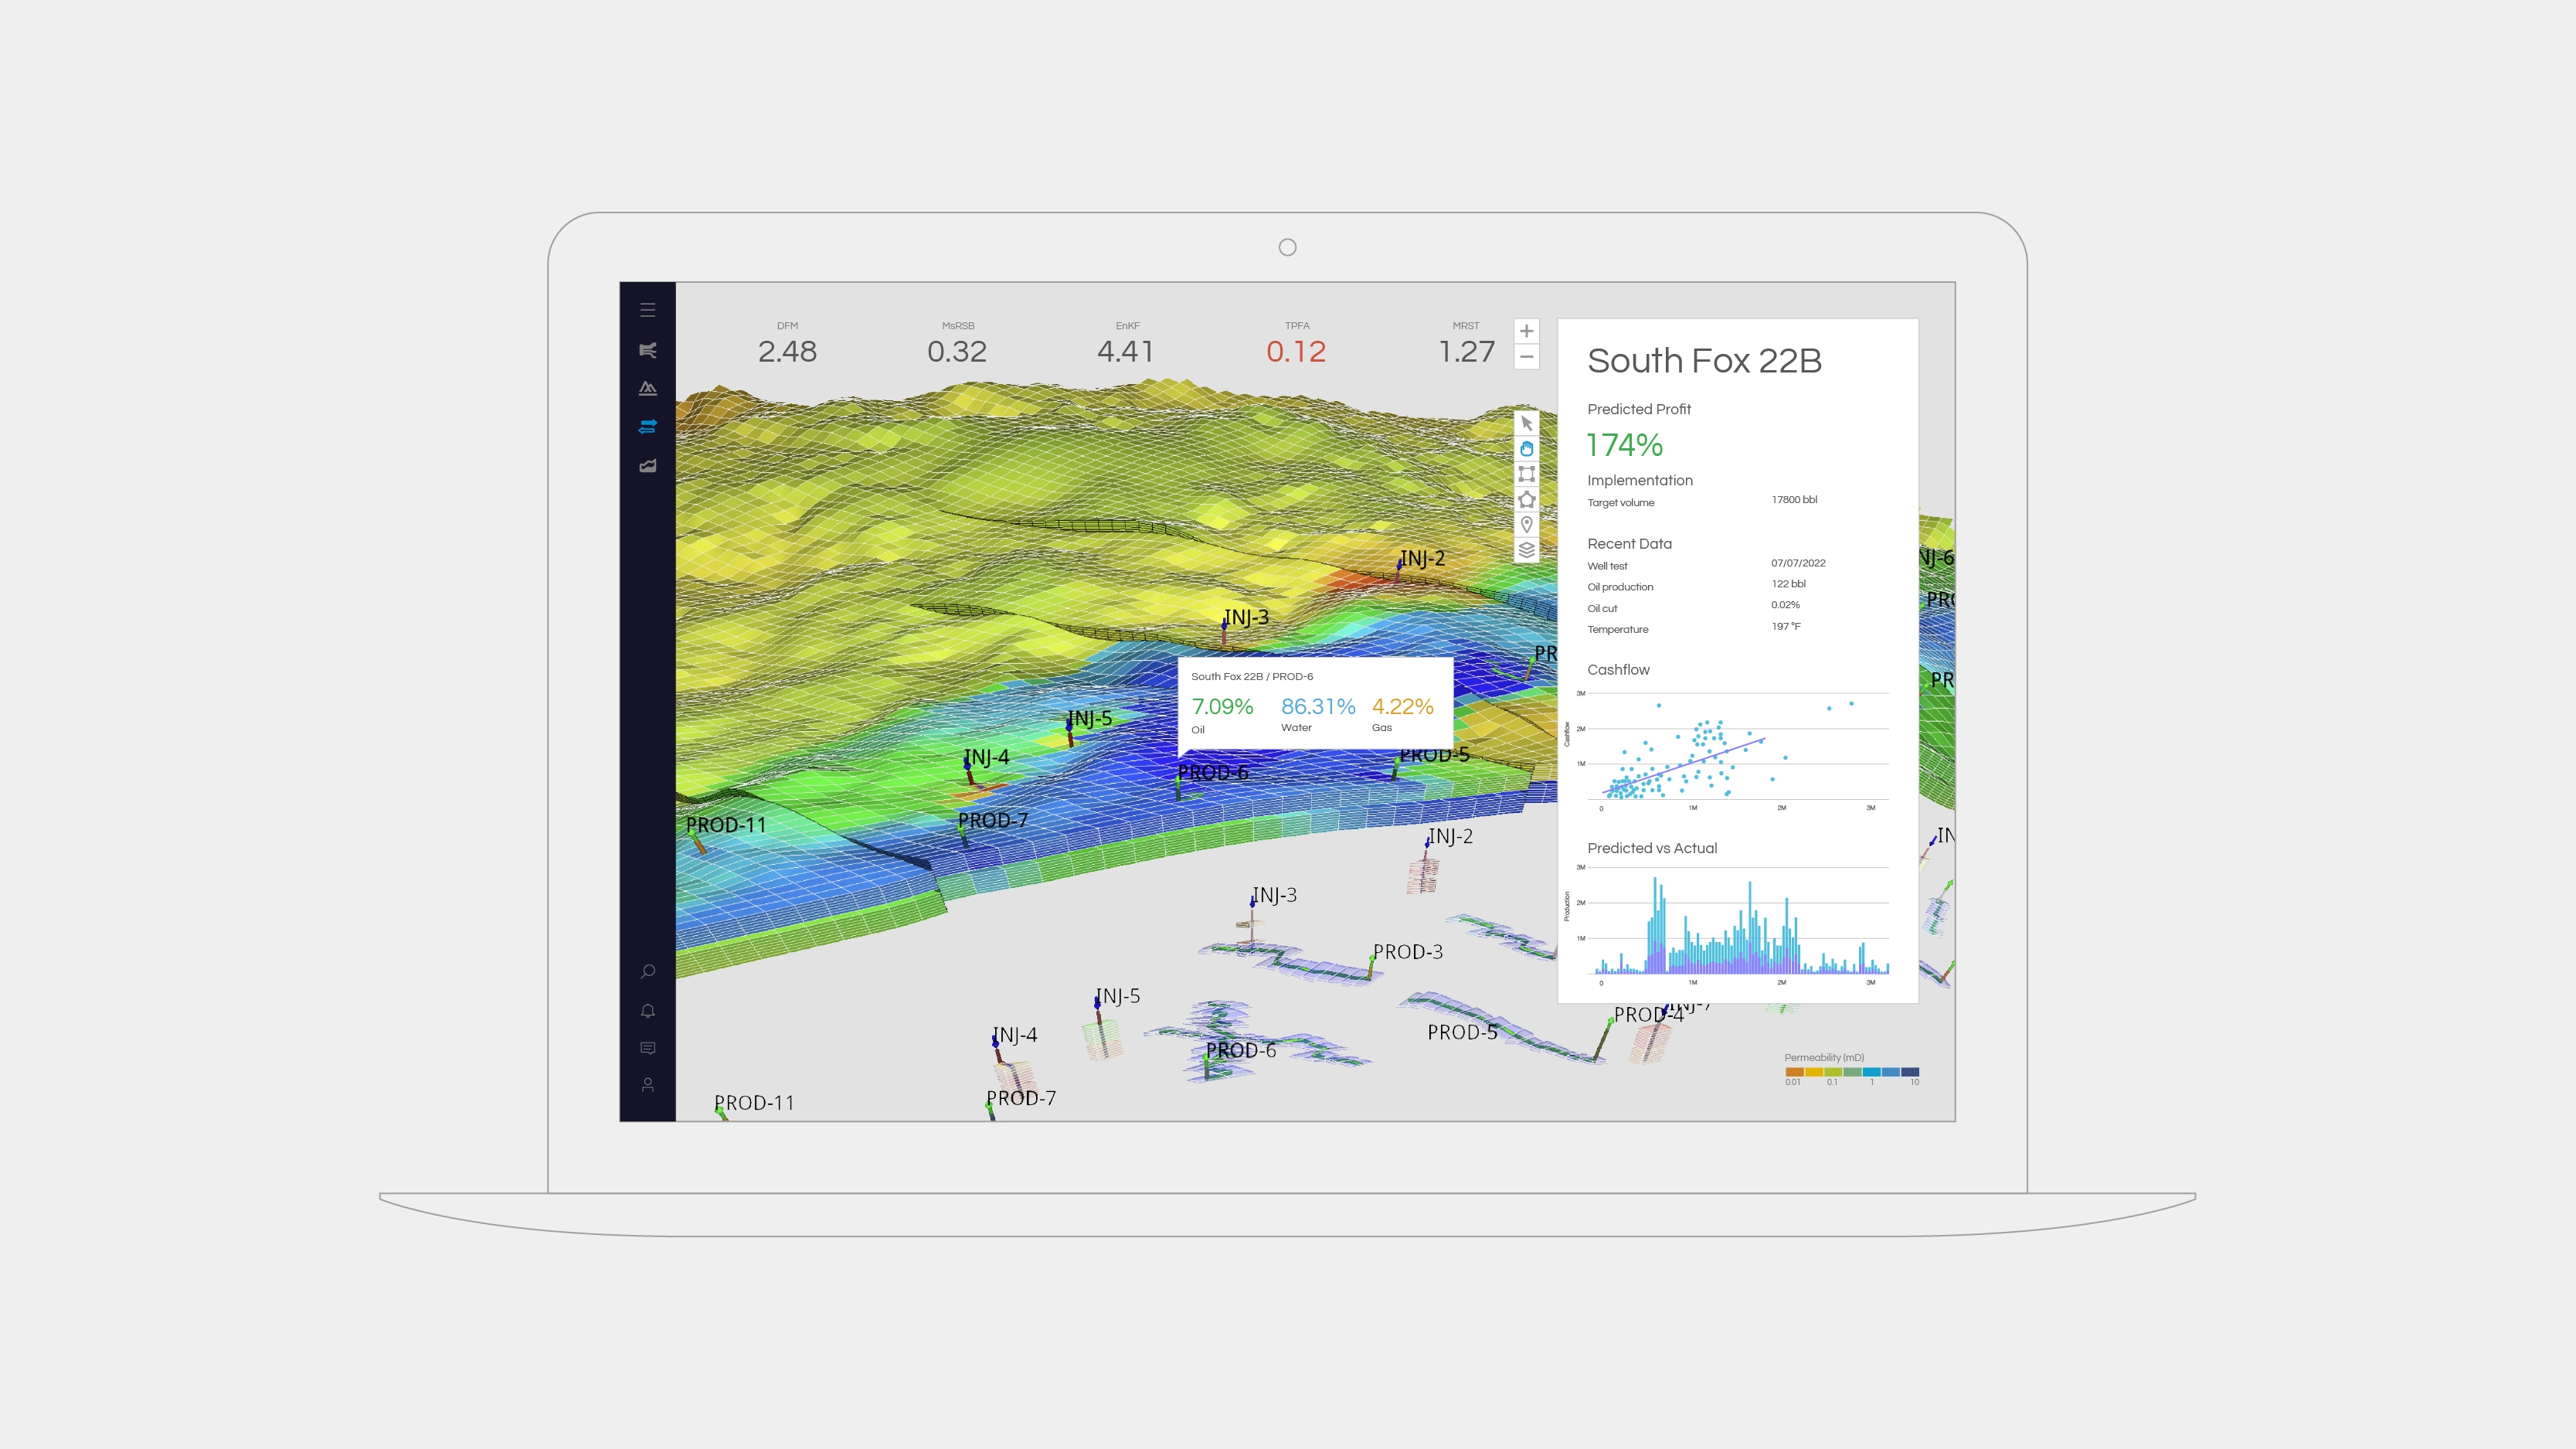
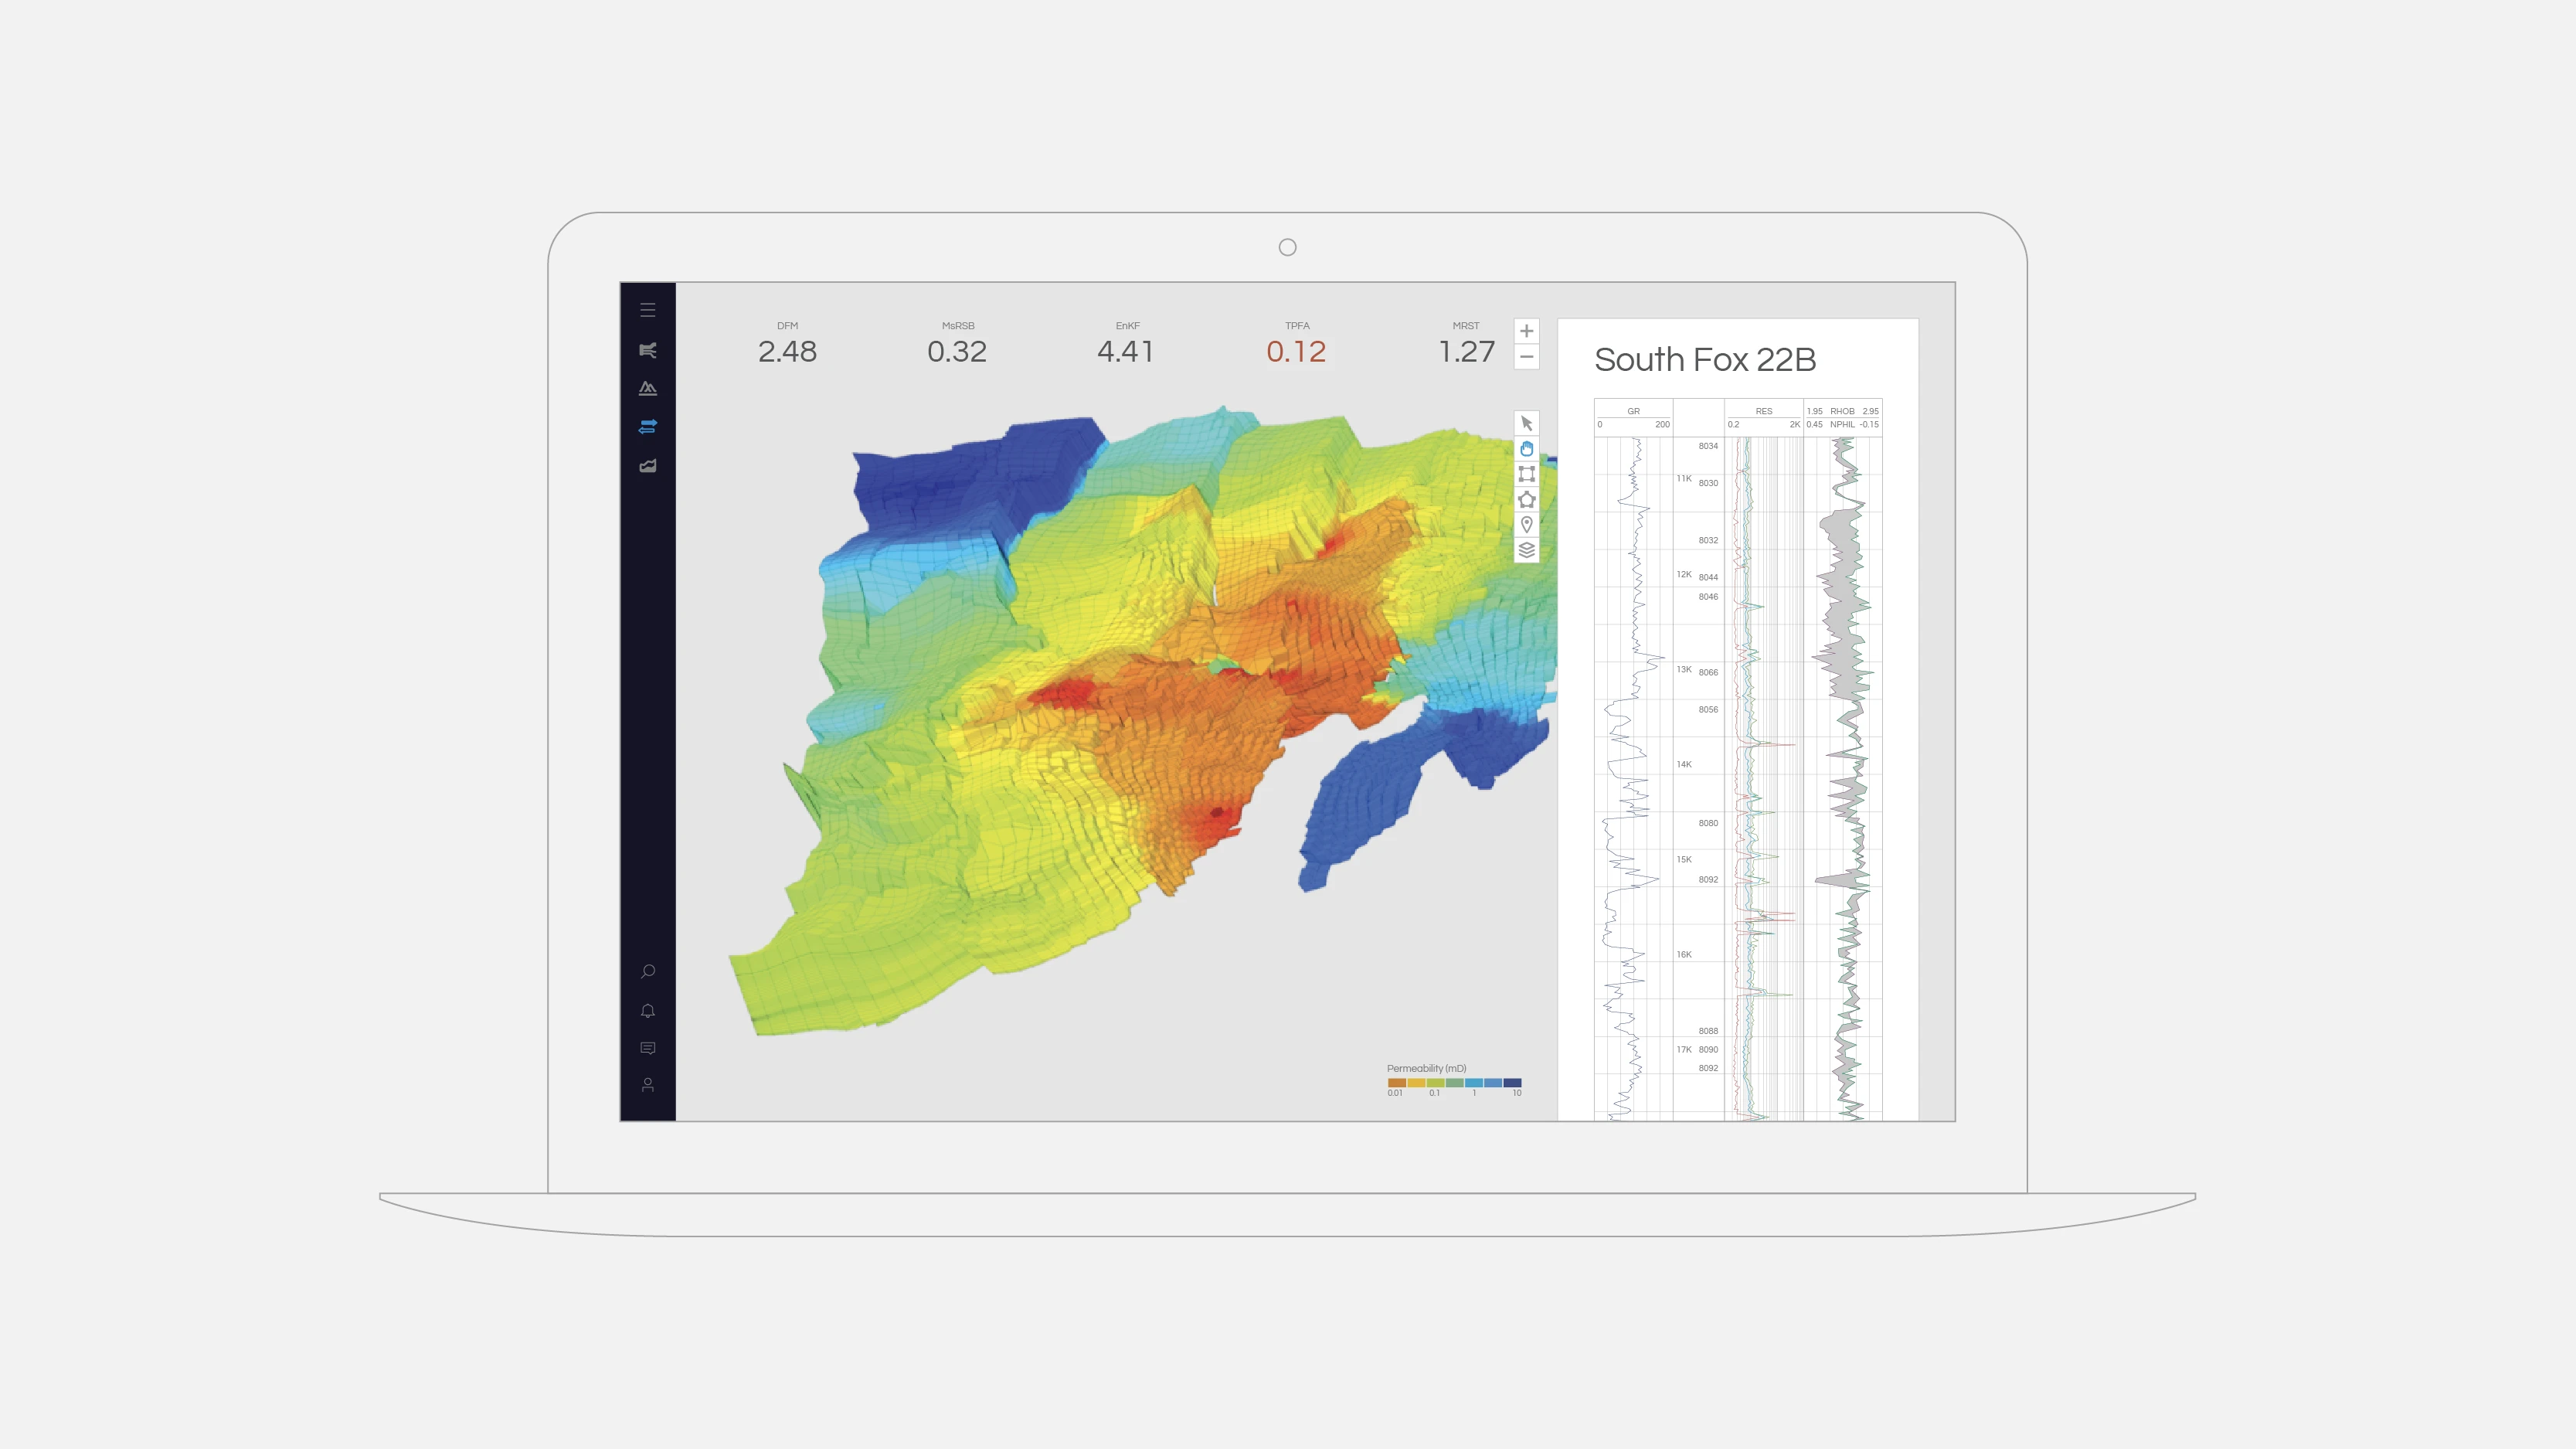
The predictive engine has two big components. The first piece is a data model to help people understand what’s going on underground. Some people picture an oil reservoir as a sea of oil, but it’s more like a sponge. So we built a model for that physical system that’s part machine learning and part physics, and that’s our secret sauce to help us predict the future of an oil reservoir. The second piece is an optimization engine that measures long-term value vs short-term production. By combining these two paradigms, our predictive engine ran the data model millions of times in parallel in just hours to help clients take the most optimal path for decades out.
Given the moniker of Hypercube, the prediction model was named for its four data dimensions: time, schema, version, and geolocation. At each single point in time in the history of an oil reservoir, there are thousands of data versions, and all of these outcomes stack up to one metric of risk/reward and cost. Multiplying that by the well’s decades of life span and you get a massive amount of data to work with.
We then not only suggested just one best future but multiple best possible futures, since different people define what’s best differently based on requirements and limitations. Think Doctor Strange, who saw all 14 million scenarios, but there were the best picks for every single universe in the multiverse. With the most optimal plans in hand, you’d be more confident knowing the best scenario to implement now and over the next 50 years.
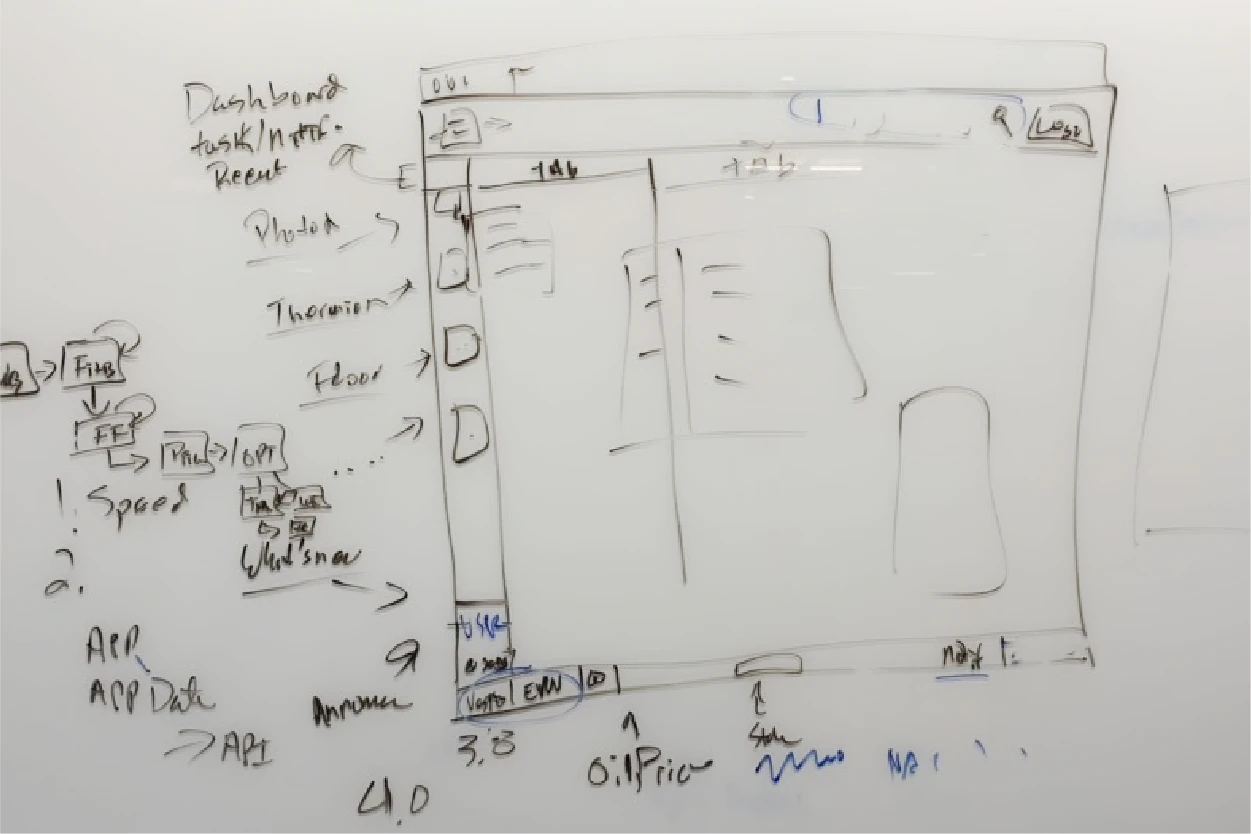

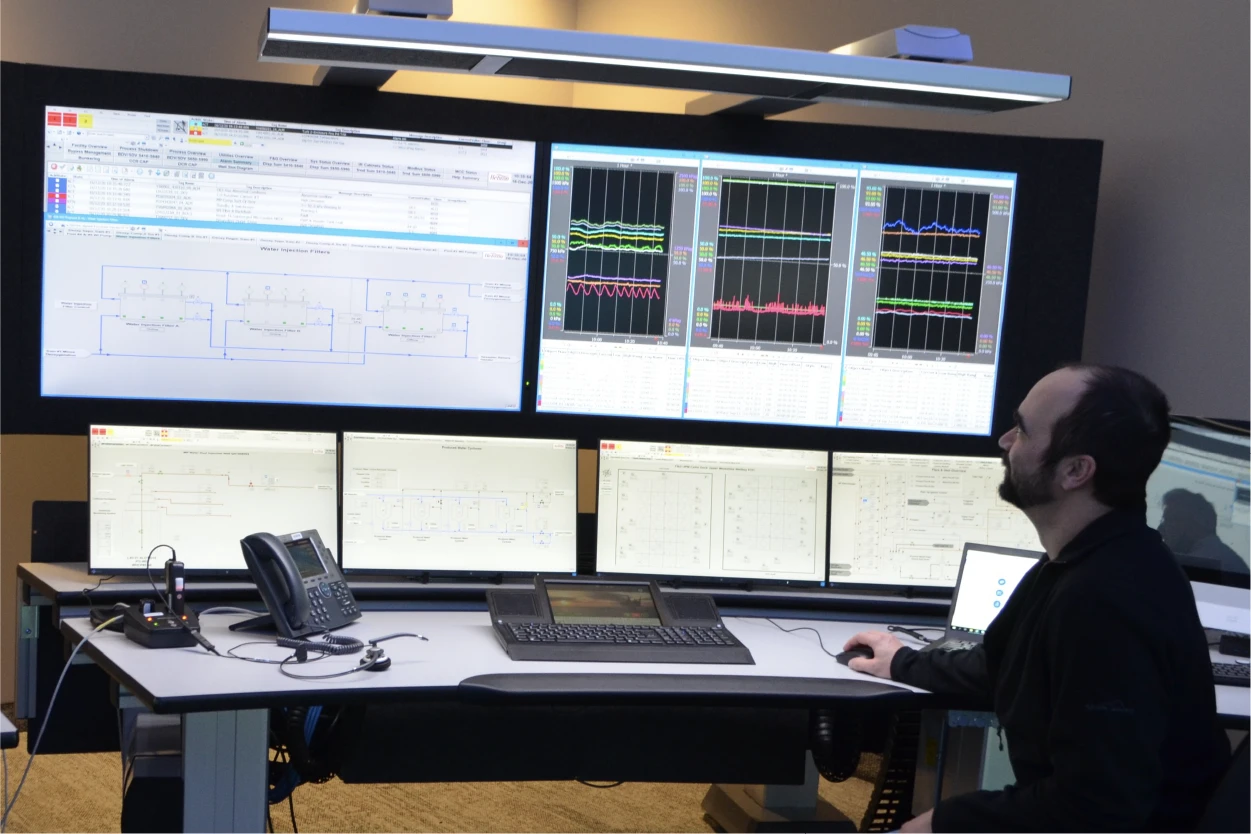
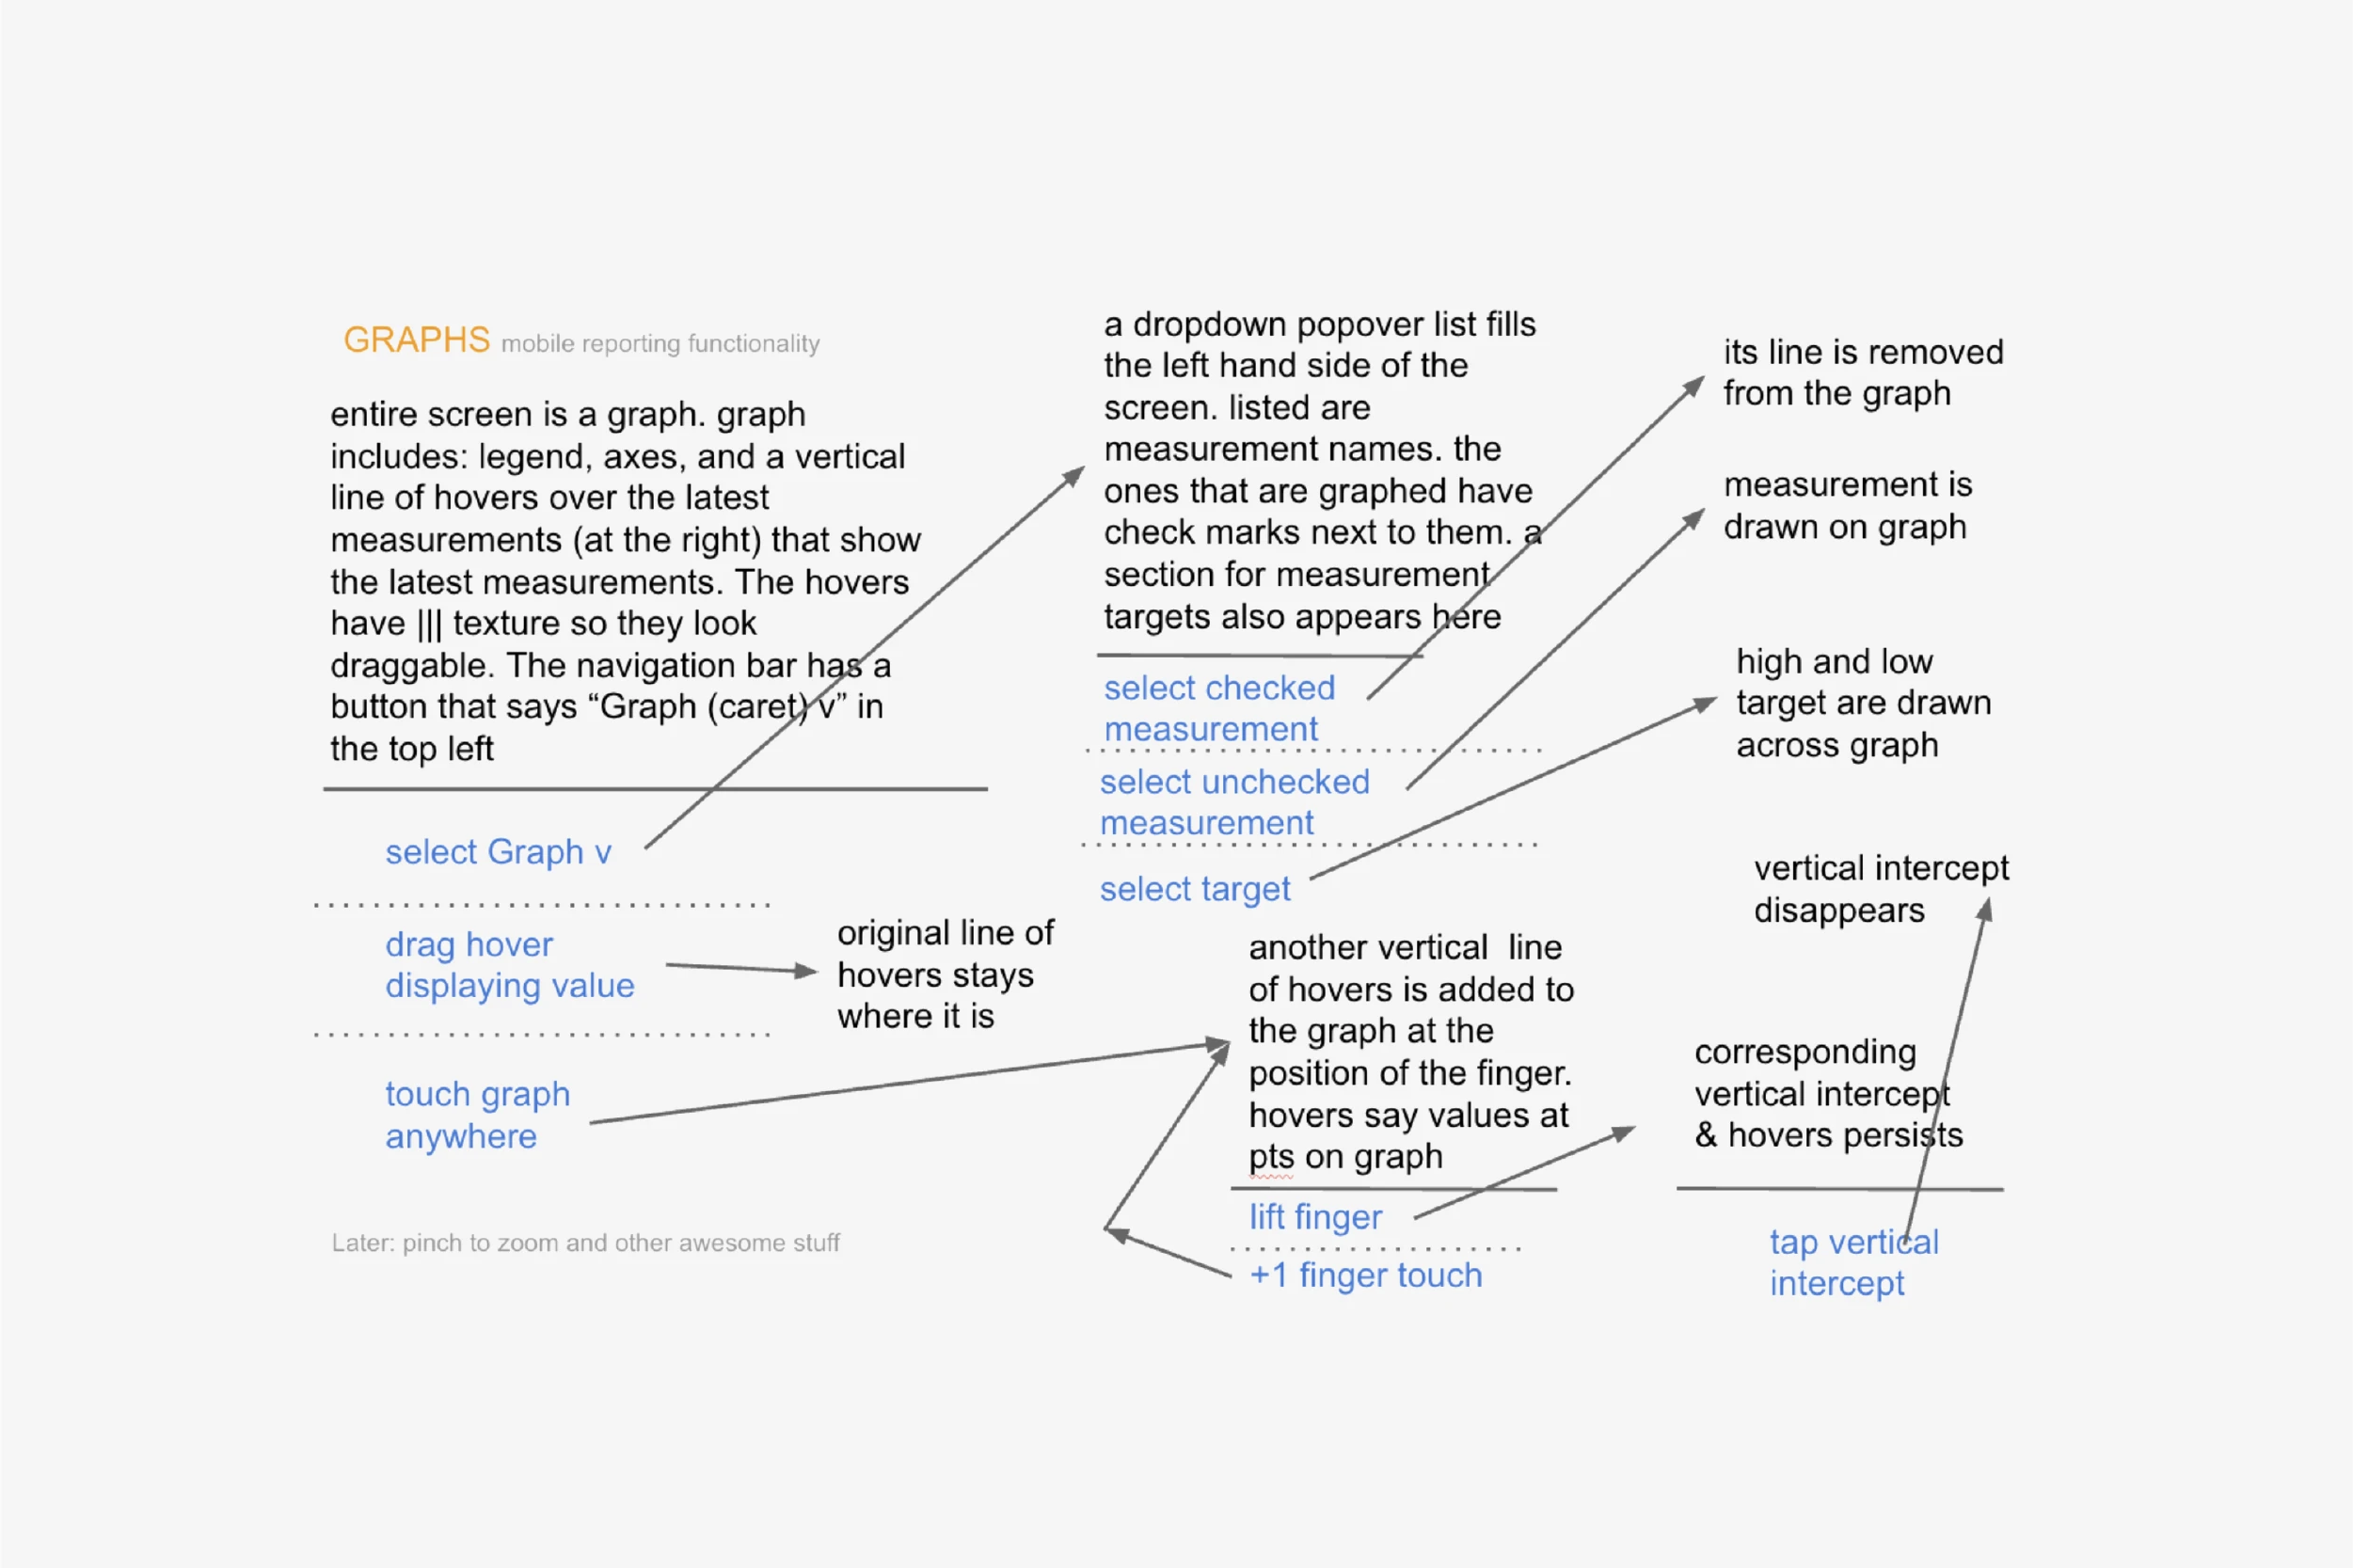
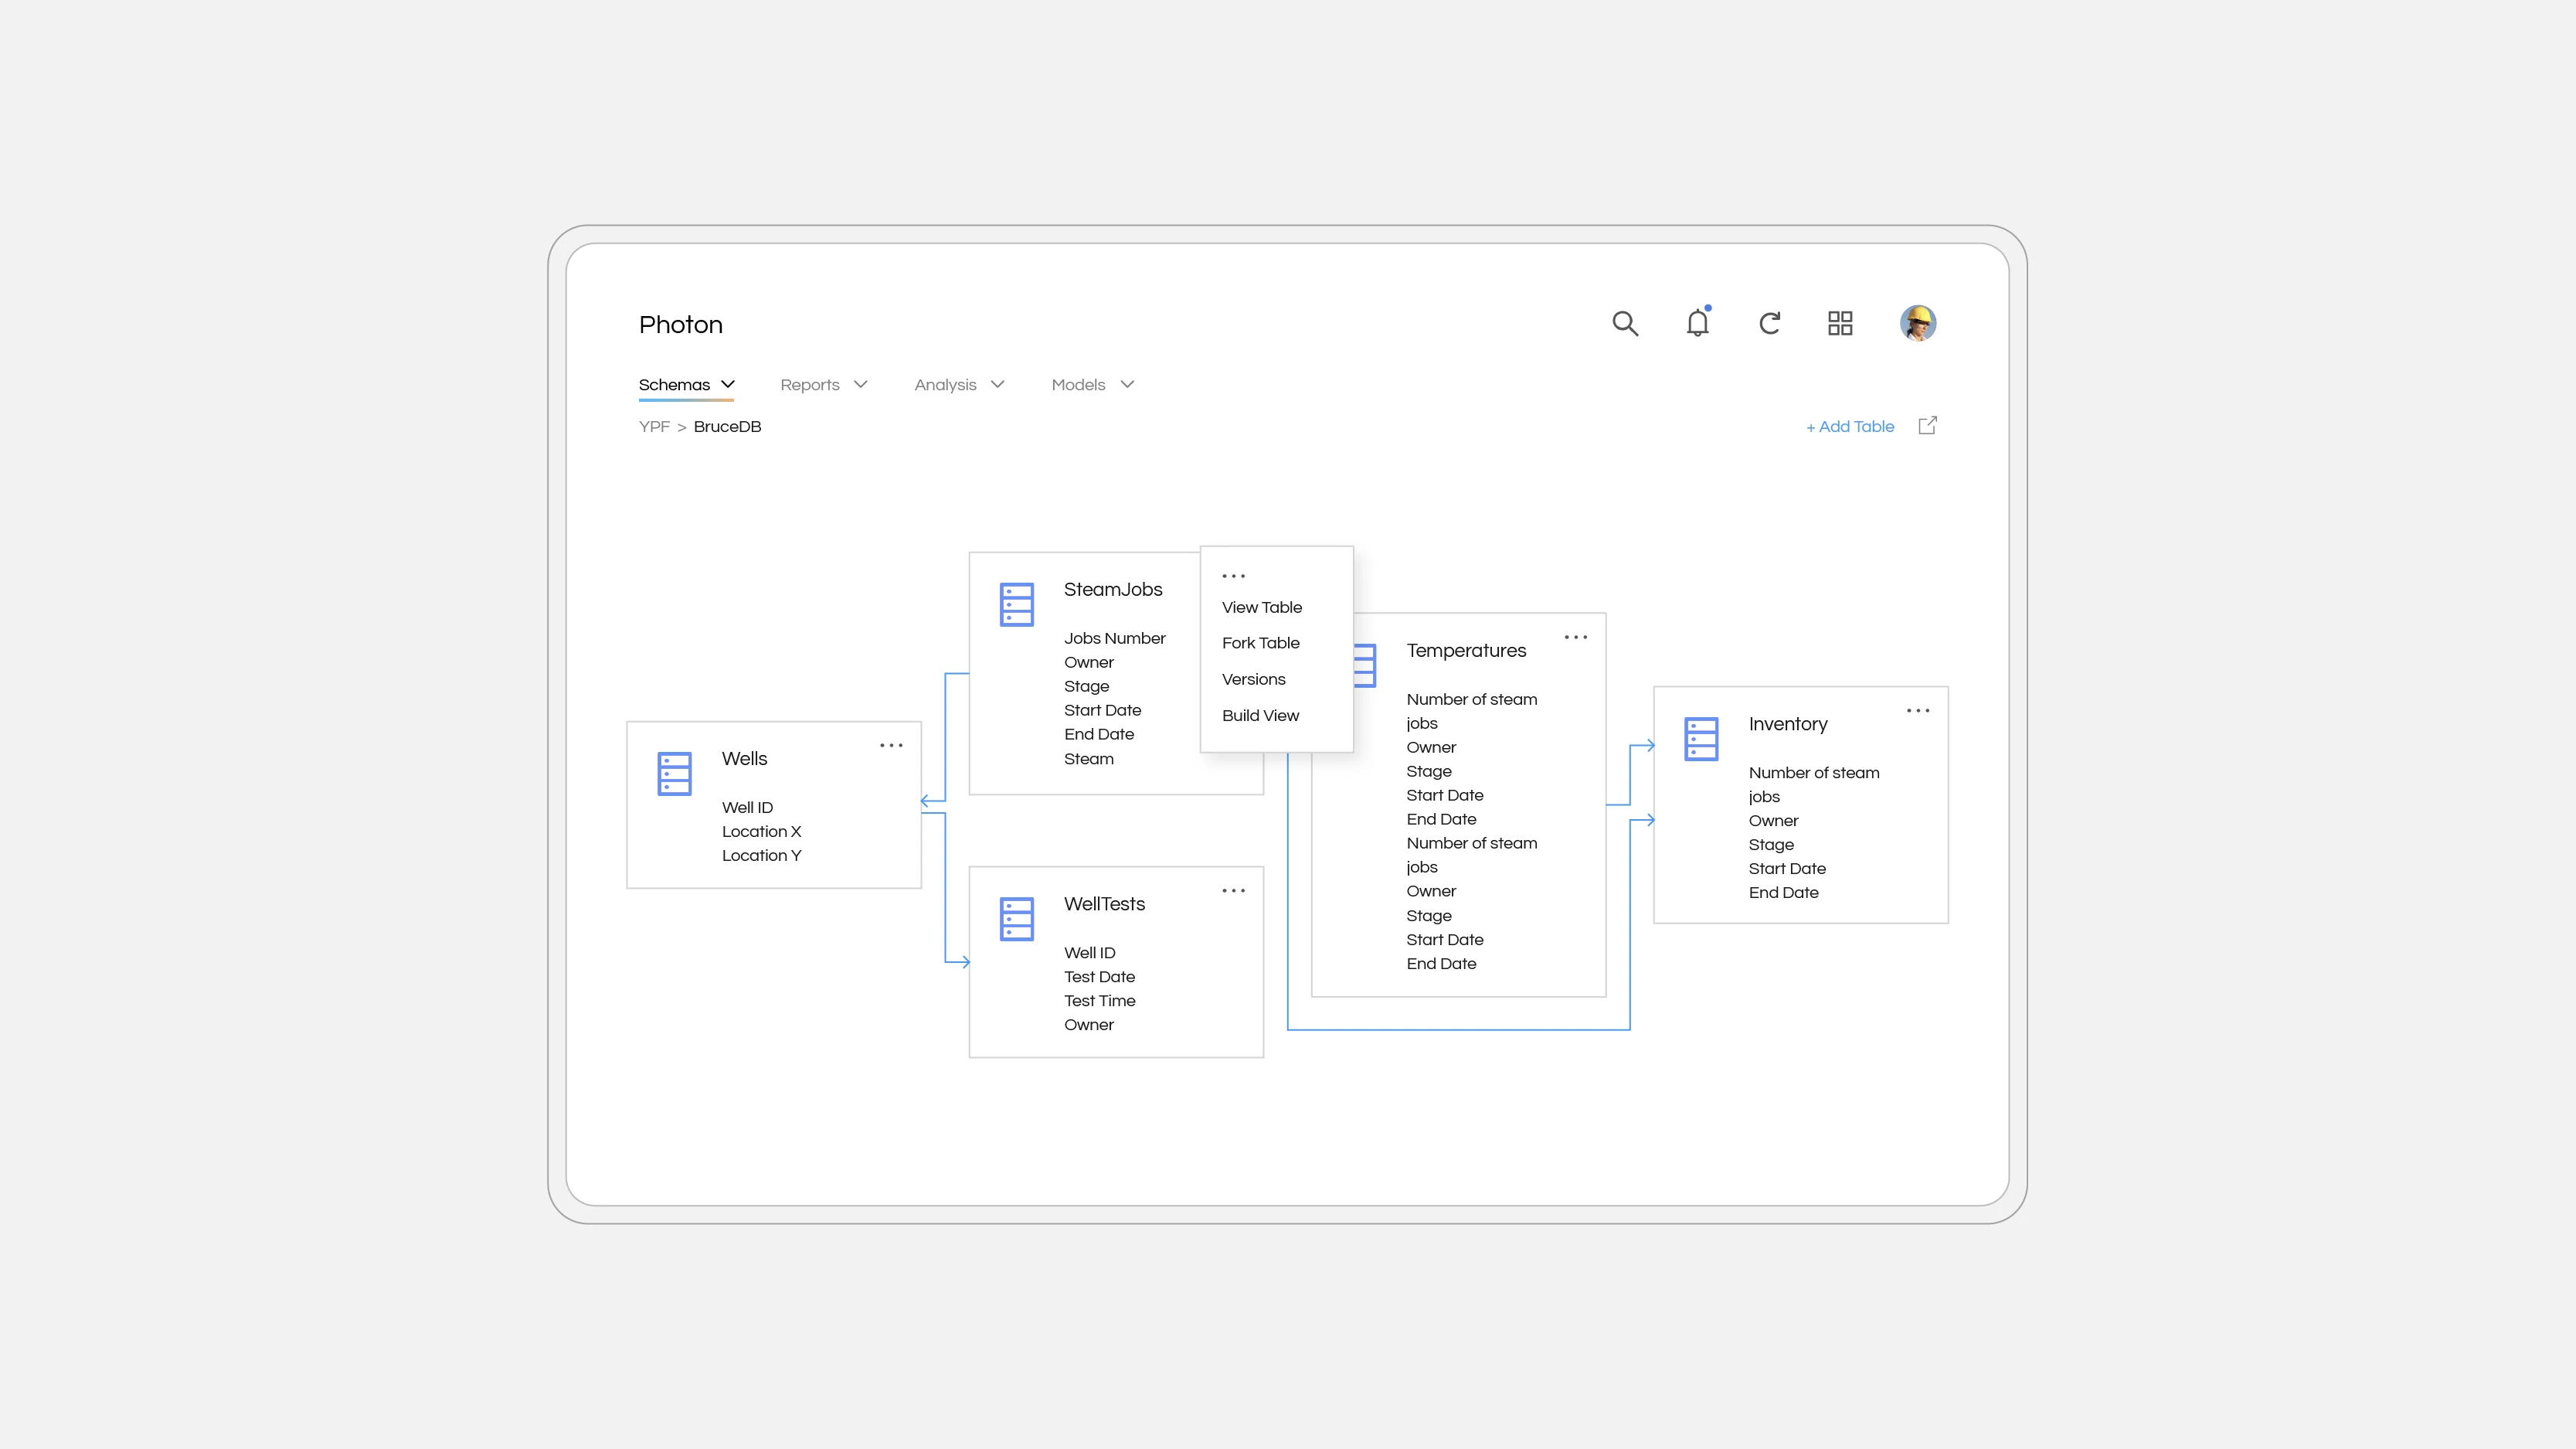
User research in enterprises has always been limited, especially in the oil & gas industry, where there are only a handful of major companies globally. For users to be able to easily make sense of the massive data, we decided to make our product flow in a similar fashion as the existing tools they normally use to cut down on learning curve, so they would get a good head start at navigating the product and focusing on the actual analysis work. We would progressively improve the user experience to be consumer-grade down the road.
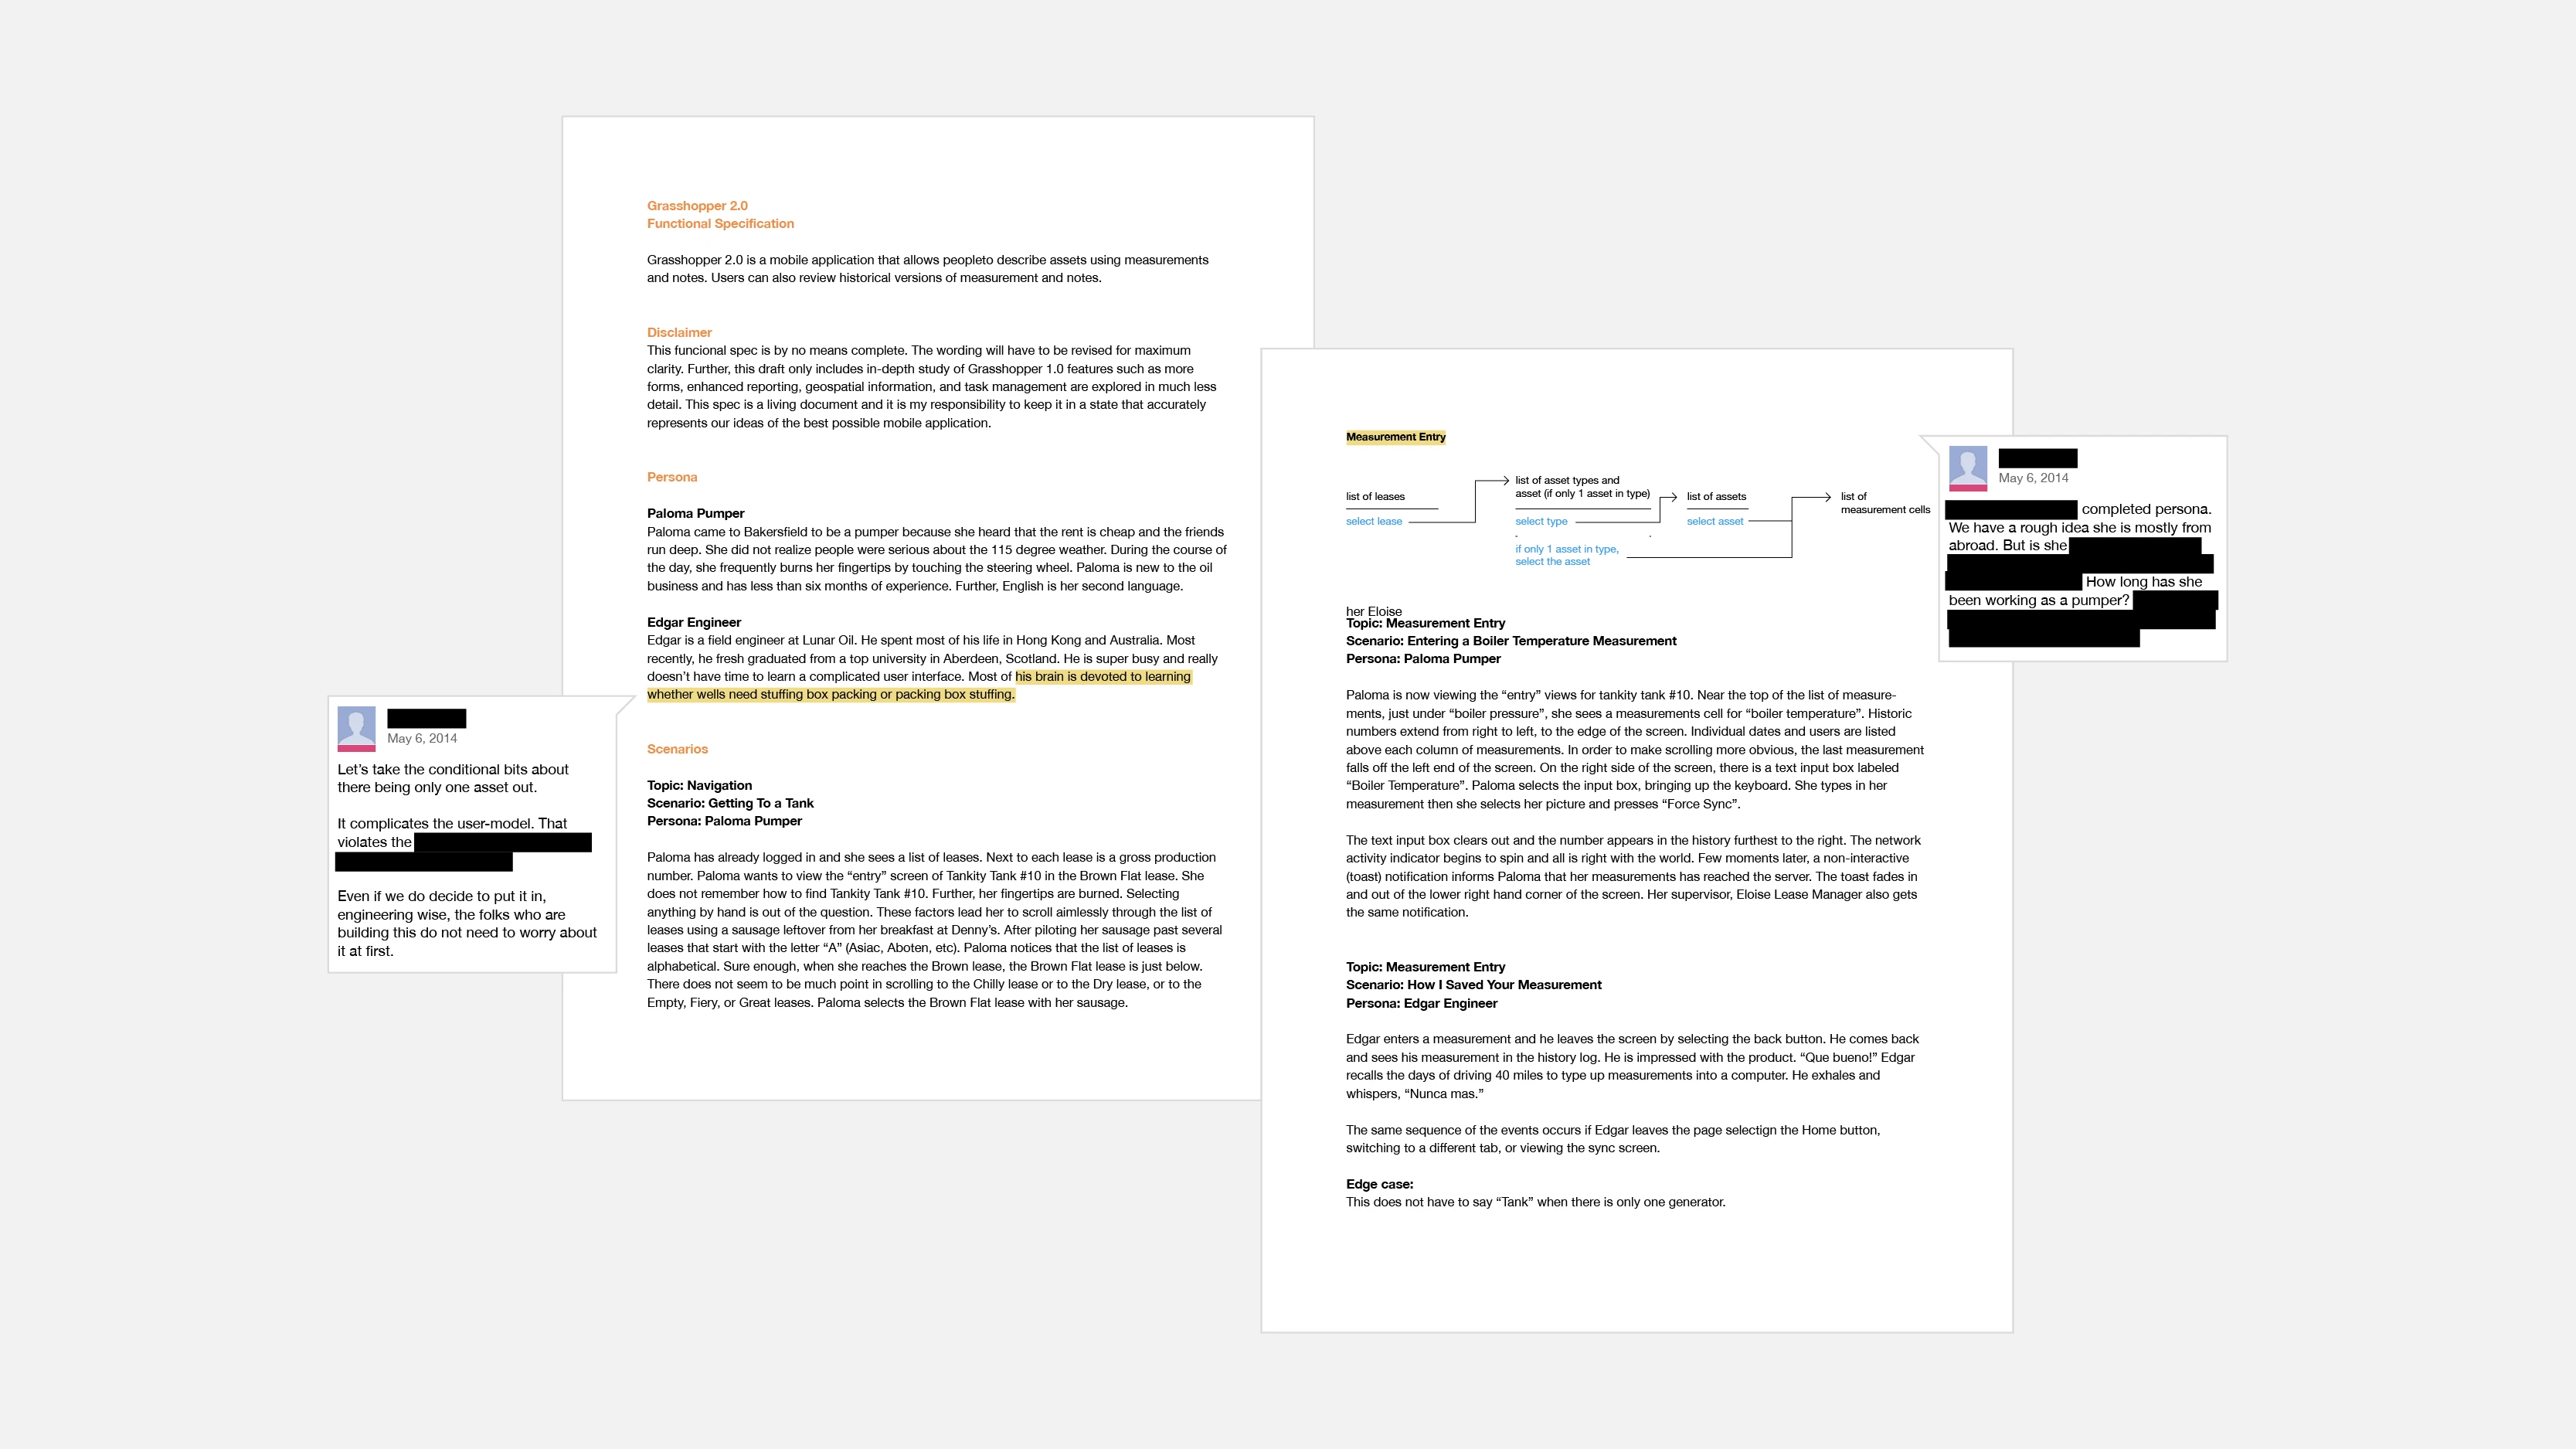
Looking for more ways to study target users with limited resources, I initiated UX training programs and workshops to equip our sales engineers with the ability to conduct user research when they meet with prospective customers. We also looked into secondary sources to run research with and ended up connecting with the petroleum engineering faculty at top universities. We conducted empathy workshops with the students using role-playing to allow us in the challenges faced by petroleum engineers in which they were provided a set of personas to get into character to embody the professional’s experiences. Through the workshops, we gained a close to first hand immersive learning of the various types of users, including field operators, drilling engineers, data scientists, reservoir engineers, and project managers.
Since we worked with all of the supermajors who fill up your tanks from day one, localization for people in non-English speaking countries was essential. We’ve more recently worked with NOCs (national oil companies) outside of North America. Most of the world’s production is nationalized, and we’ve worked with companies in Latin America, Asia, and Europe. It was challenging to say the least, to design the user interface to provide bidirectional text support (BiDi) so that the software can seamlessly display script from both right to left (RTL) and left to right (LTR) writing systems on top of supporting multiple languages in the same time.
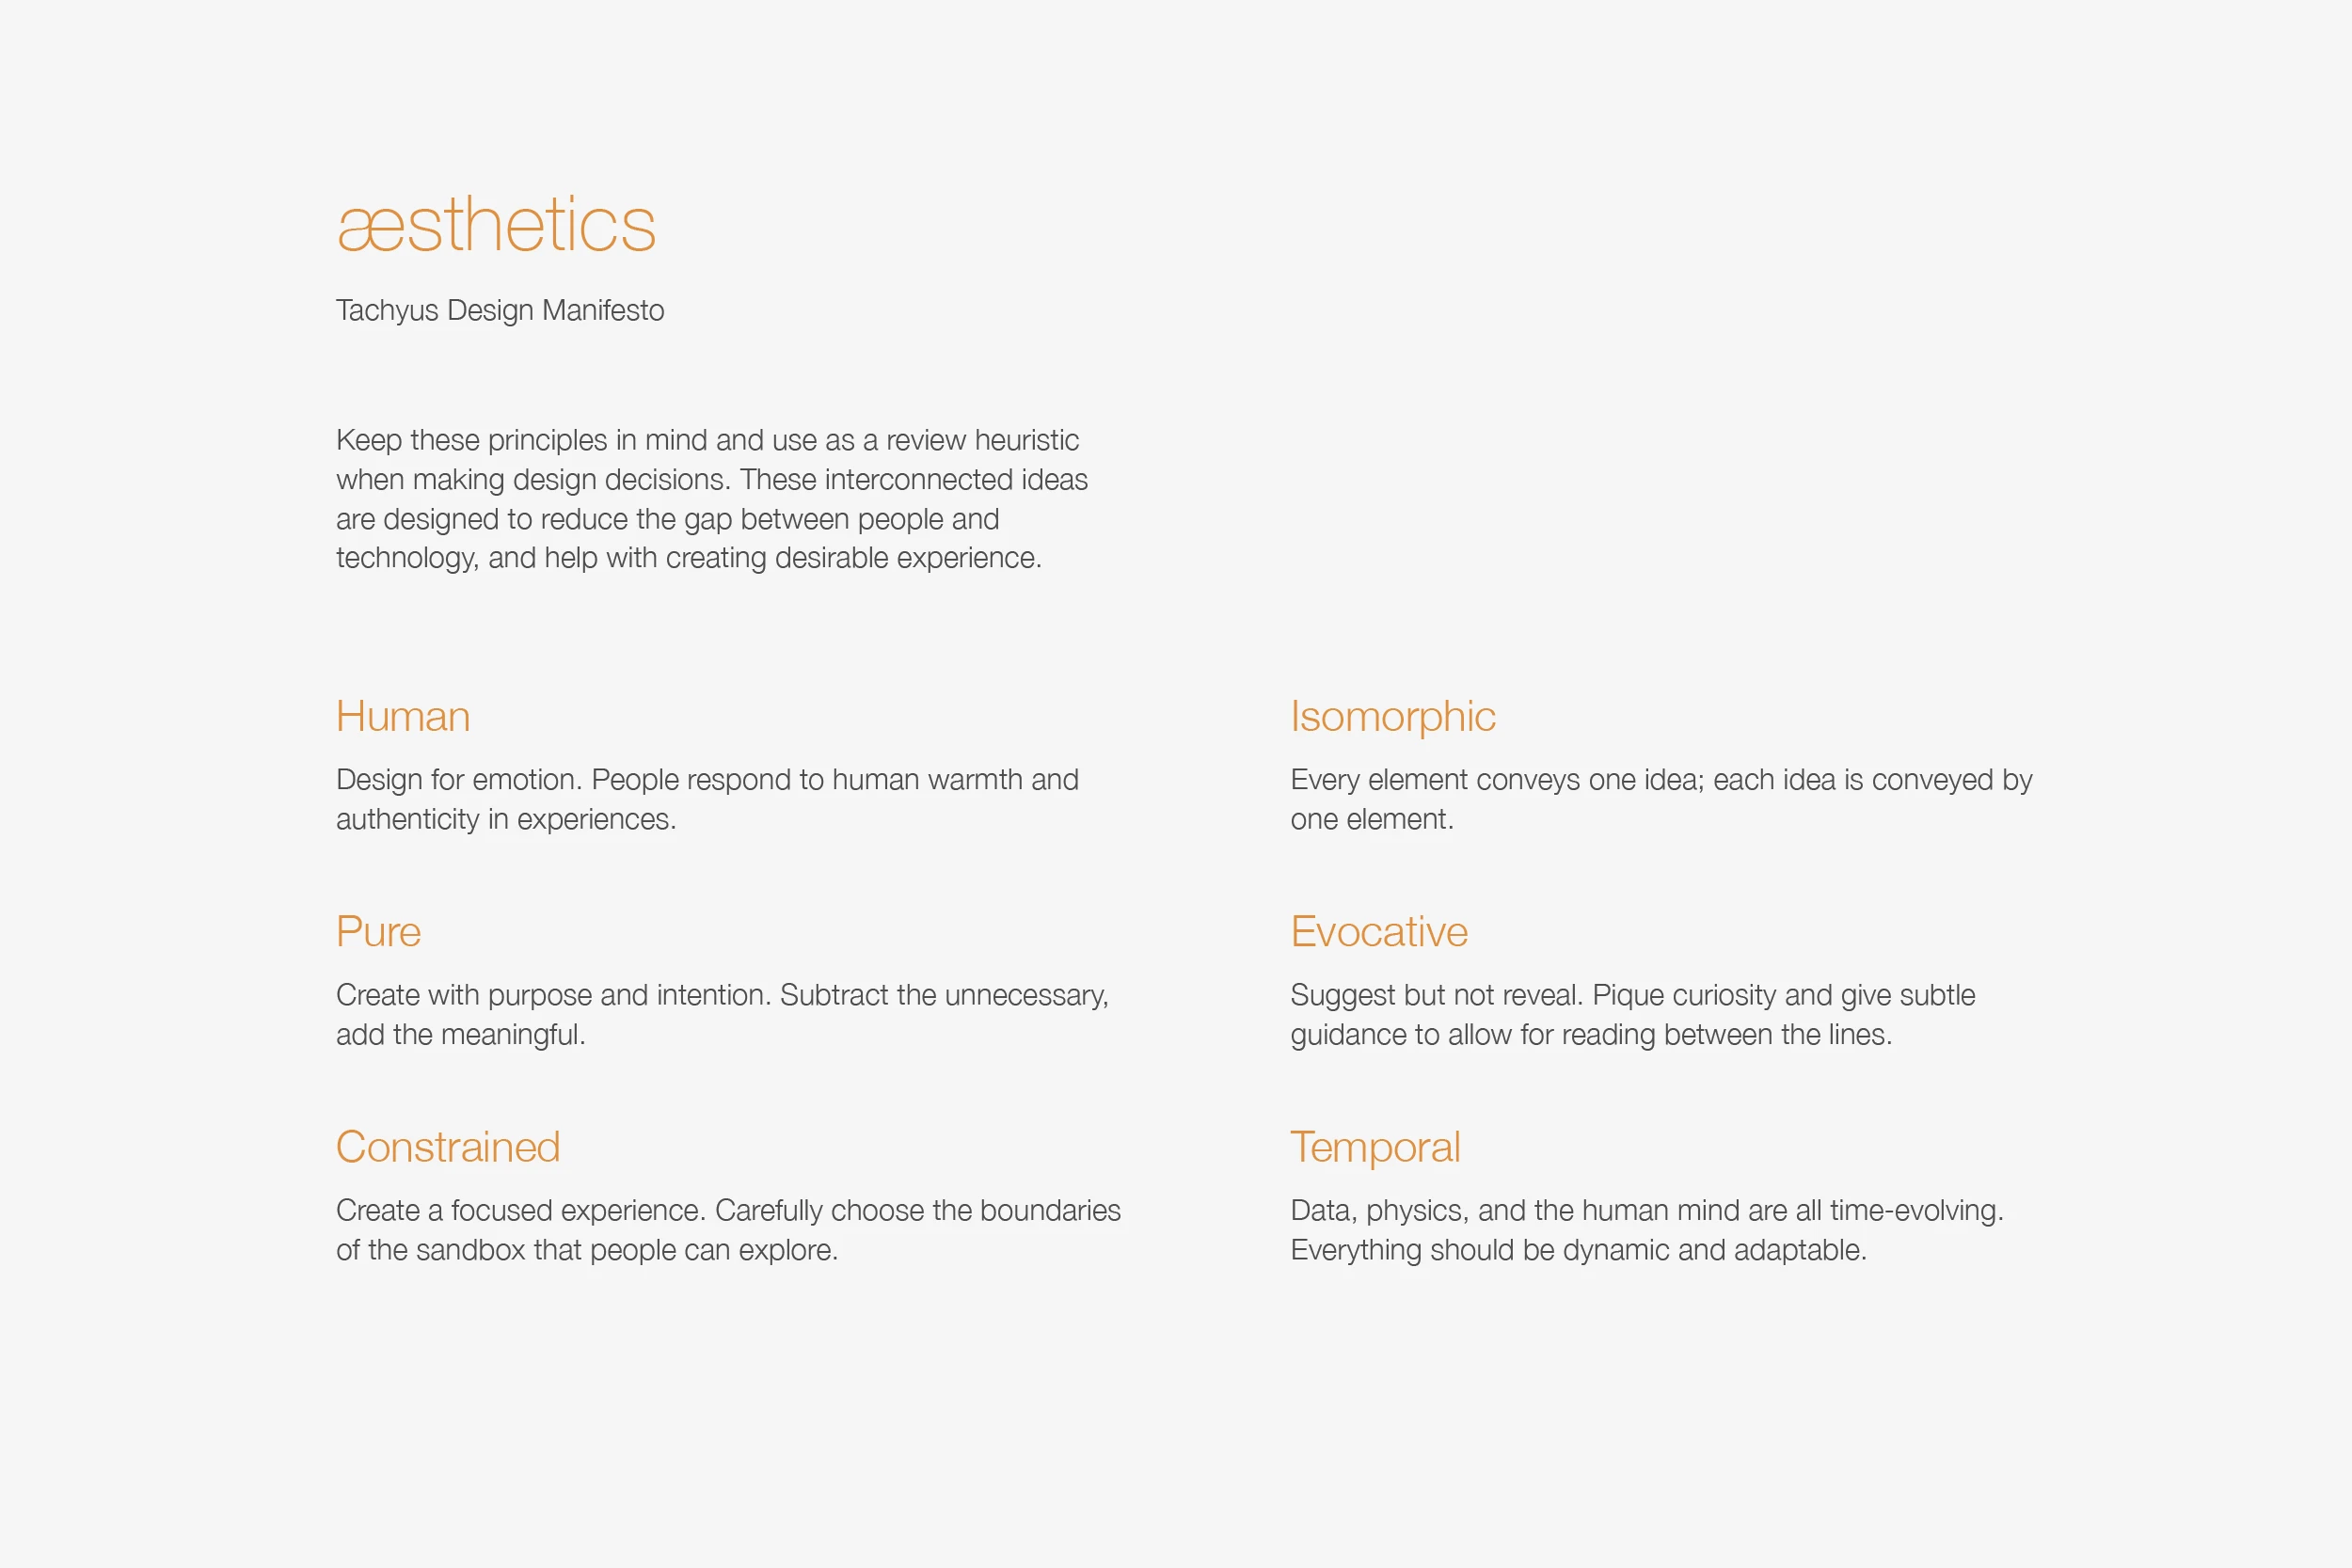
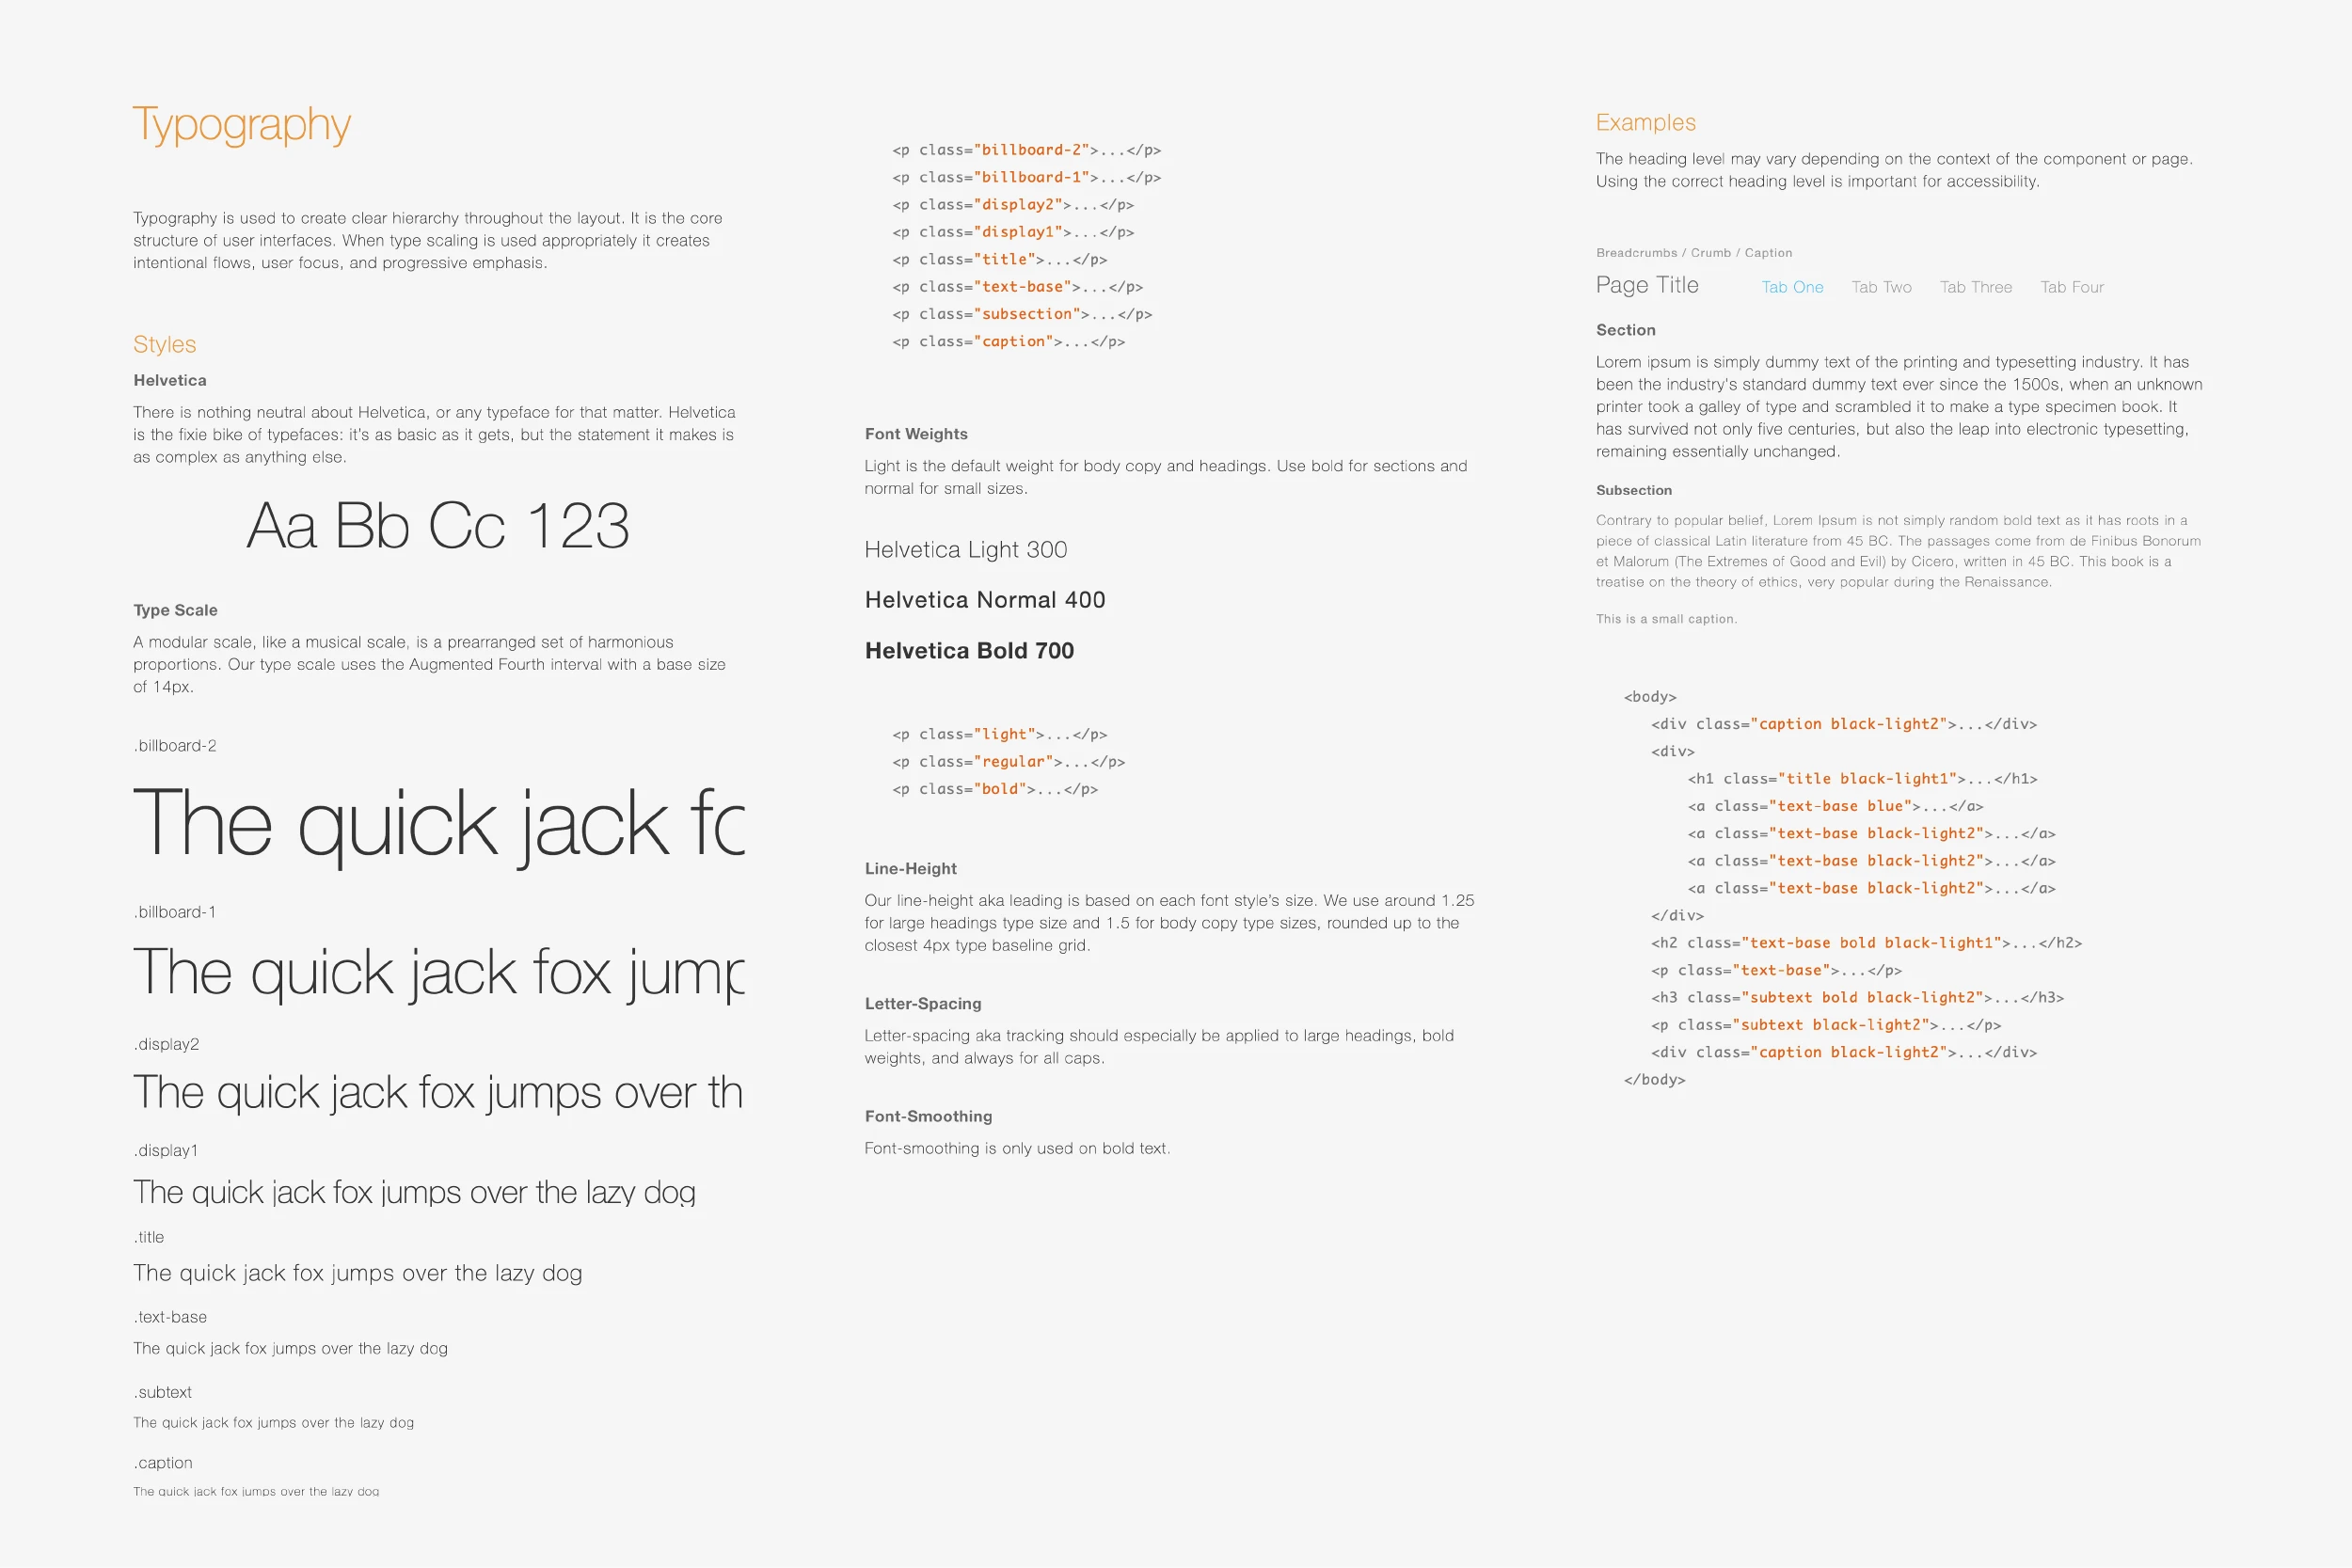
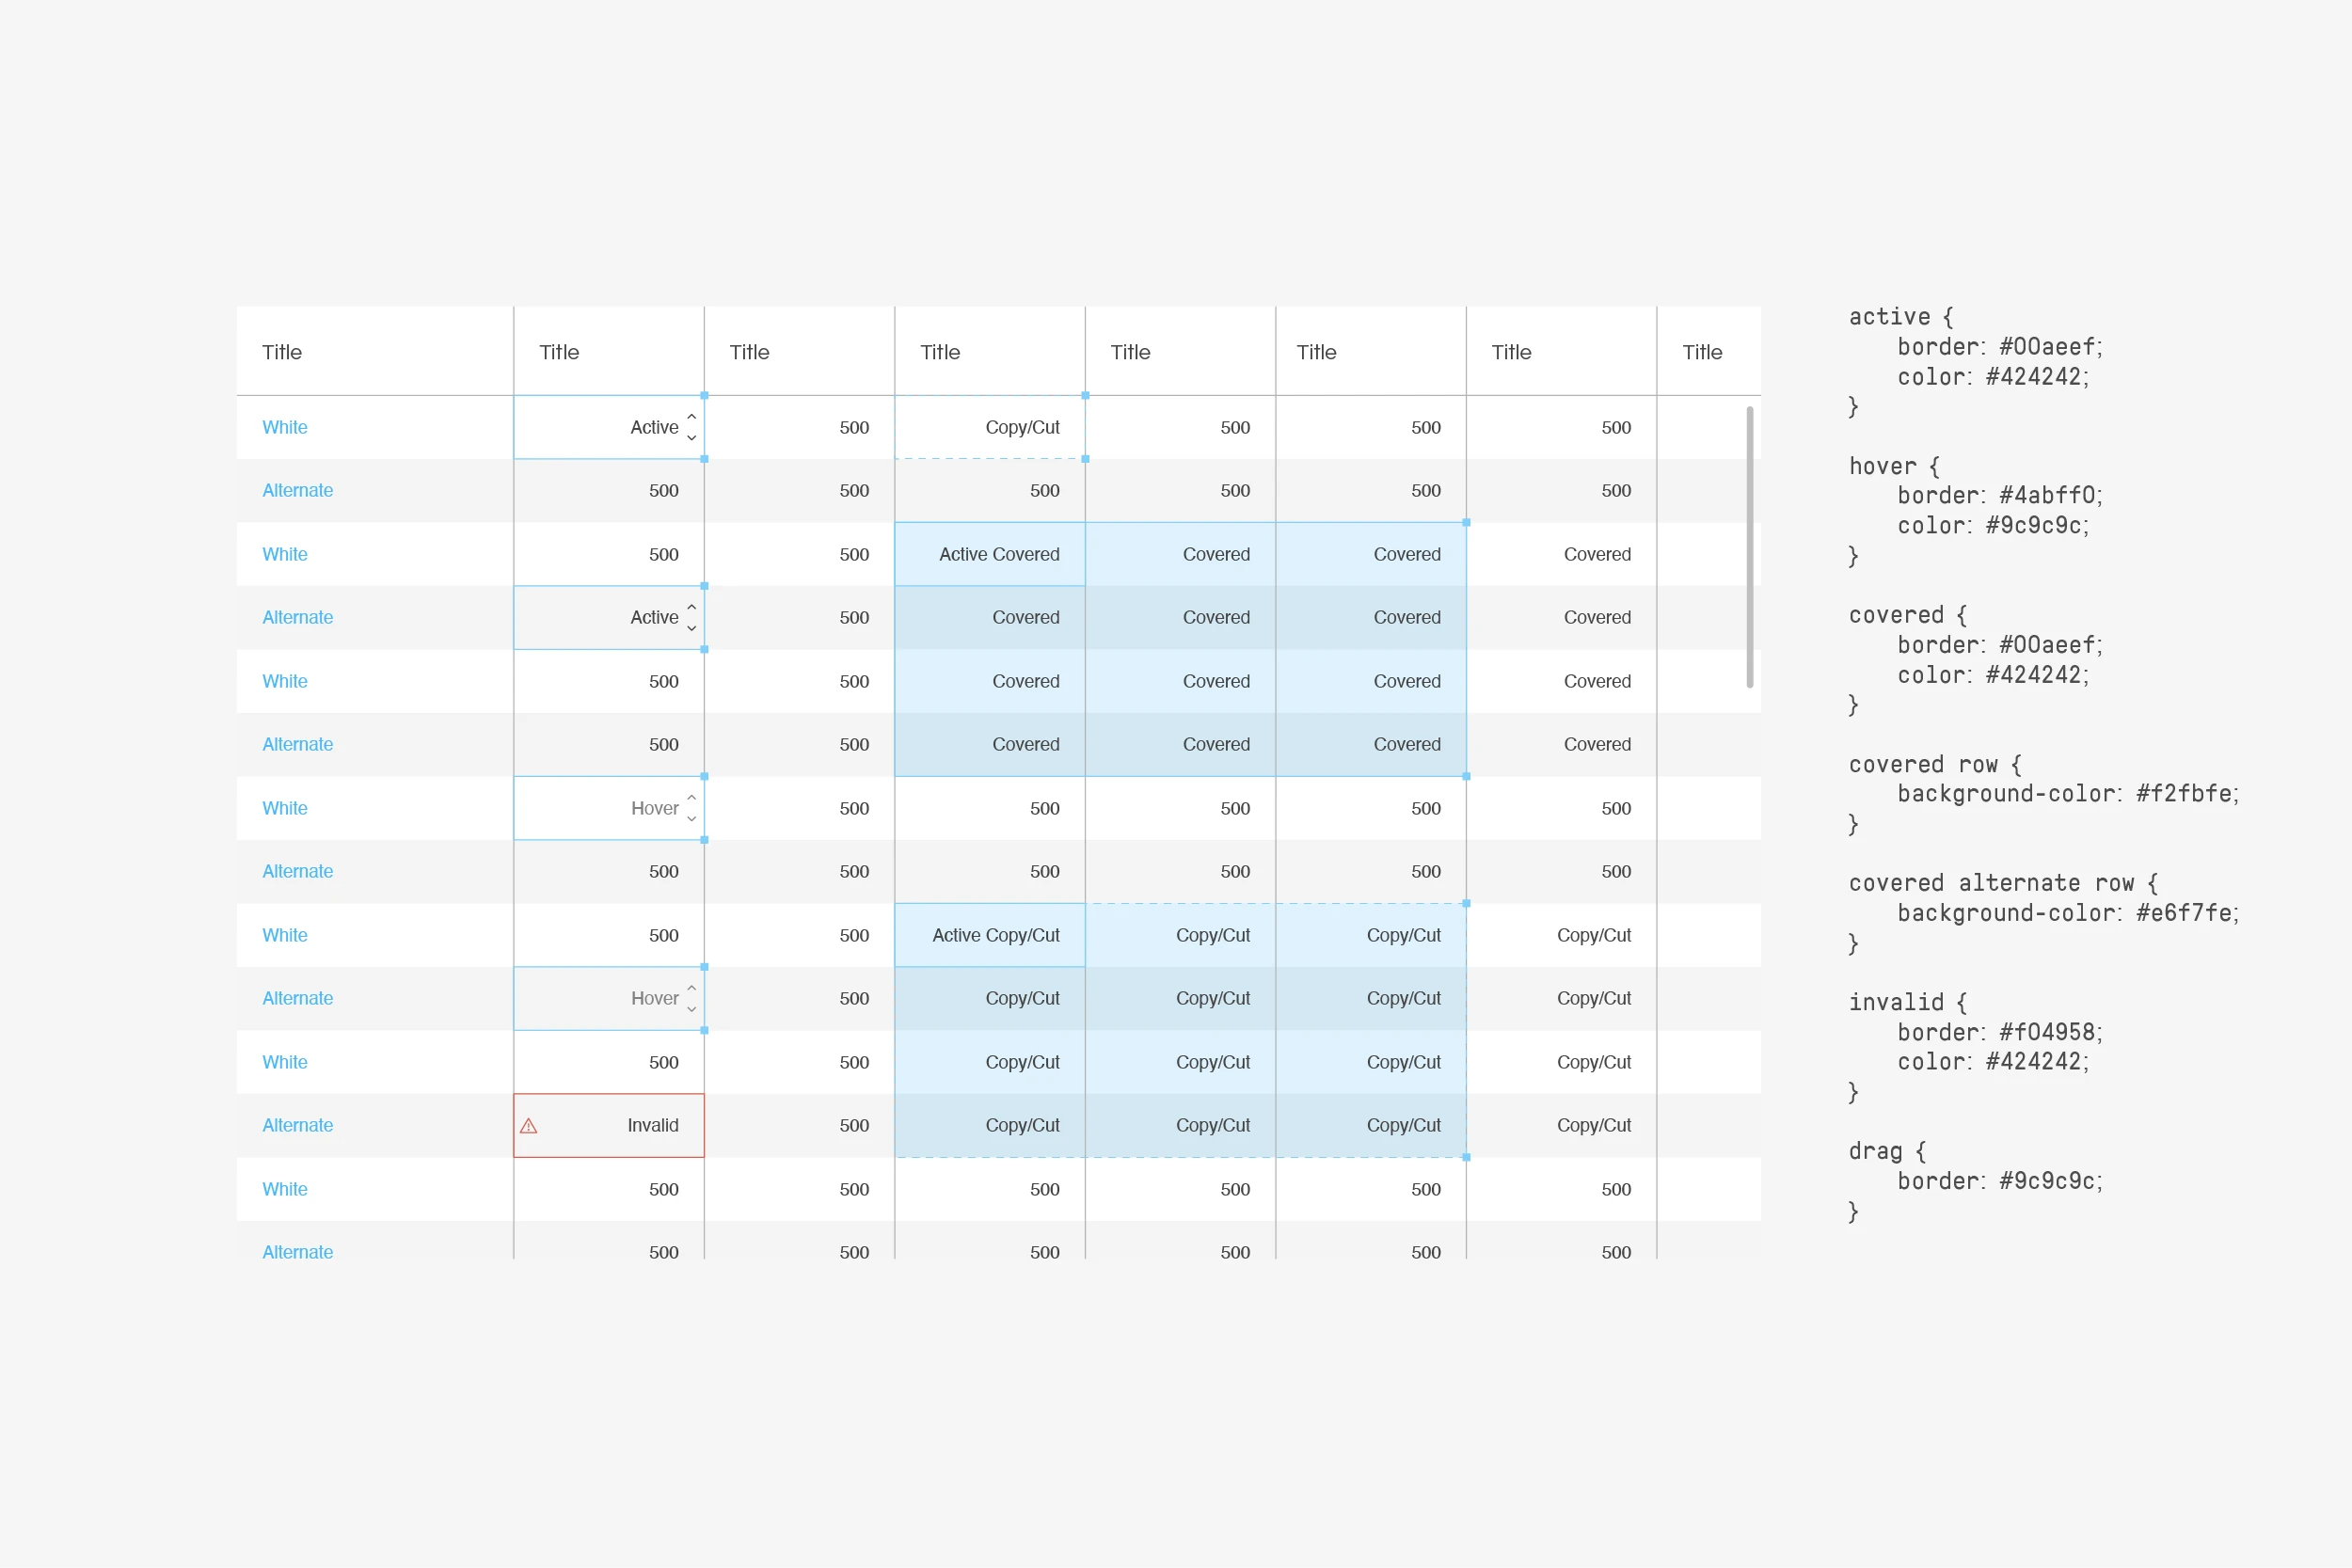
For the following iterations, I created a design system with north star design principles and interface components to speed up the development. Based on Atomic Design, I named it Standard Model, borrowed from the particle physics theory, and subsequently renamed the system stages to Atoms, Molecules, Compounds, Substances, and Matters to make the convention easier to grasp.
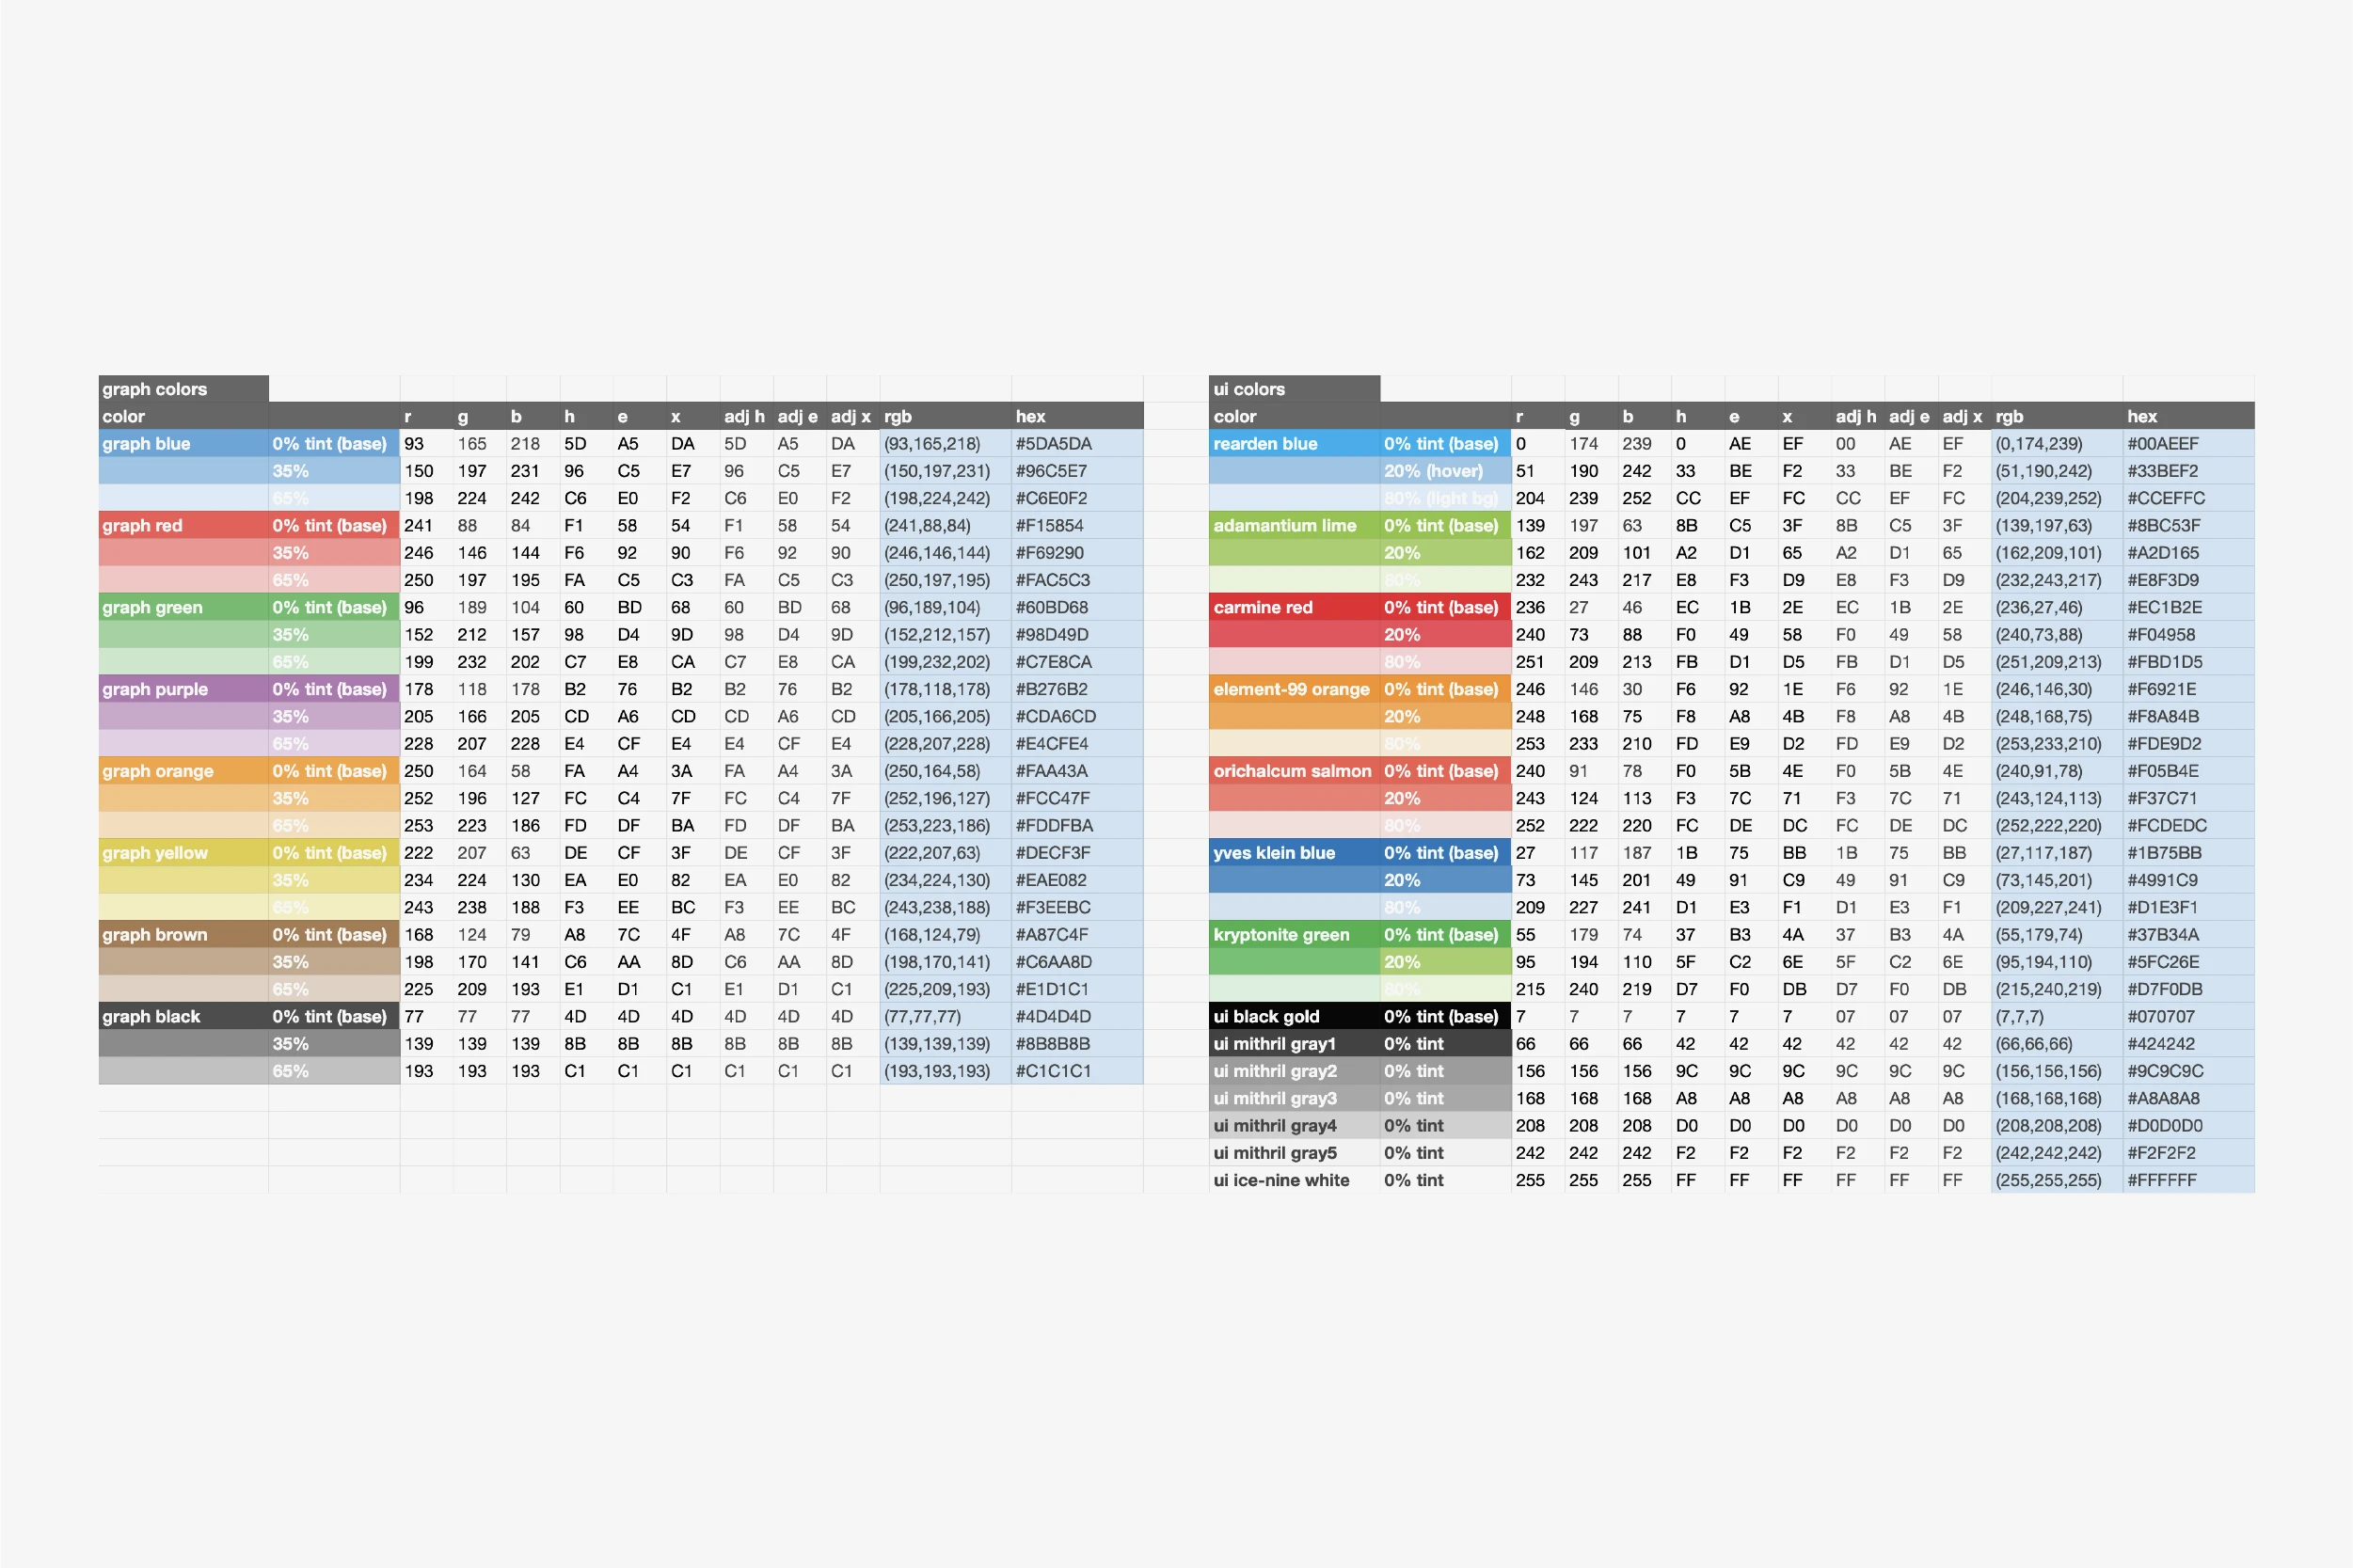
I also created a system to automate different shades and tints that can expand a given color to be a set of 10 colors total to use in data visualizations and I probably had too much fun naming the colors inspired by fictional elements such as Mithril Gray, Rearden Blue, Adamantium Lime, Element-99 orange, Orichalcum Salmon, and Kryptonite Green. This helped developers make informed design decisions while having fun and freed me to further improving the experience for the users and jump in to help with production code where needed.
The response from customers has been overwhelmingly positive. The buzz in the oil and gas industry has sparked conversations around machine learning and the value of our product.
Operators of varying sizes have leveraged our products and services across 25,000 oil wells to achieve up to 20% increase in production and up to 40% decrease in water injection cost, especially in complex reservoirs.
Design
JJ Moi
Development
Paul Orland / Ryan Riley / Jack Fox / Adam Jensen / Karlkim Suwanmongkol / Cameron Taggart / Lanny Wang / Kim Reardon / Chris Gervang / John Orland / Ryan Hilliard
Further Readings
→ AI startup focused on oil and gas to grow – Houston Chronicle
→ Oil and gas Industry Service Award
→ Data startup for oil industry, raises from Founders Fund – New York Times
→ Prescriptive analytics modeling technology captures reservoir physics